


- Elliott Wave
- March 24, 2026
- 2 min read
Silver Prices Swing Near 200 SMA [XAGUSD Elliott Wave]
Executive Summary
- Silver prices (XAGUSD) declined about 50% from the all-time high to yesterday’s low.
- A 61.8% Fibonacci wave relationship also appeared near yesterday’s low.
- 200 Day Simple Moving Average sits near $57.63.
Silver has declined hard over the past few sessions reaching a low of $61.01.
The minimum waves are in place to consider the downtrend over, but the structure of the rally has yet to confirm a major low is in place.
Current Elliott Wave Analysis
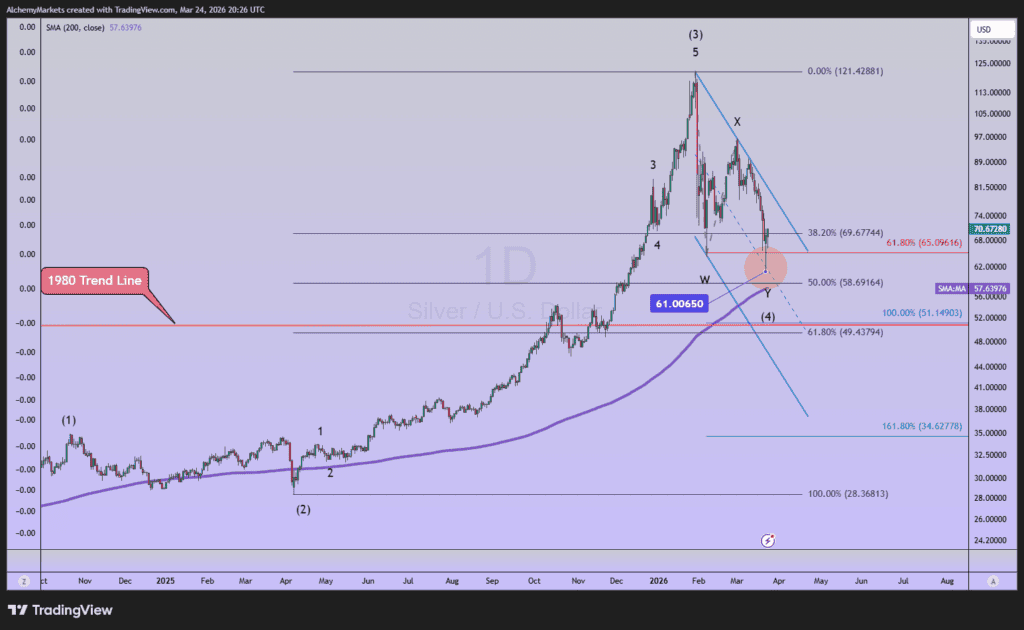
Silver (XAGUSD) prices have been declining in a wave (4). Within Elliott Wave Theory, the impulse pattern consists of 5-subwaves. When wave (4) completes, then wave (5) would be a rally to retest all-time highs.
How can we be sure that wave (4) is over?
First, consider the depth and time taken for wave (4) to carve compared to its cousin wave (2).
Wave (2) corrected nearly 19% over 117 daily price bars. This wave (4) has corrected nearly 50% over 37 price bars.
It is common for wave (4) and wave (2) to alternate in their pattern. Wave (2) was a sideways flat and (4) was a sharp double zigzag. Therefore, it makes sense that (4) was quicker and deeper than (2).
Wave (4) also pushed near the 200-day simple moving average. Over a long uptrend, the 200 SMA is often viewed as a level of value where sellers stop selling and buyers step in.
Additionally, there are a couple different wave relationships showing up during this 2026 decline.
The 50% Fibonacci retracement level hovers near $58.69. Plus, the 61.8% Fibonacci extension where wave Y of (4) is 61.8% the length of wave W of (4).
Between $57 – $65 there were a few different technical levels propping up silver.
Though the minimum waves can be counted in place, it would not be uncommon to see silver dig a little deeper into that support zone.
Bottom Line
Silver remains in a larger degree uptrend and the correction in 2026 appears to be a temporary digestion of the 2025 gain.
Once wave (4) is completed, then a bullish rally in wave (5) will likely retest all-time highs and push into even higher levels.
A break below the 200 SMA support at $57.63 would be a cause to pause and reconsider the Elliott wave count.


