


- Elliott Wave
- January 26, 2026
- 2 min read
EUR/USD Eyeing Highest Level in 5 Years [Elliott Wave]
Executive Summary
- EUR/USD appears over half-way through a multi-year bullish flag pattern.
- Current rally may carry to 1.26 and possibly 1.32.
- Bullish view is held while EURUSD price is above 1.1578.
EUR/USD is progressing closer to the round number 1.20 price level. Once this level is reached, it would be the highest EUR/USD exchange rate since 2021.
On Wednesday, the FOMC concludes their 2-day meeting with their latest interest rate announcement. The Fed is anticipated to hold rates steady with the street anticipating the next rate cut in June 2026.
Current Elliott Wave Analysis
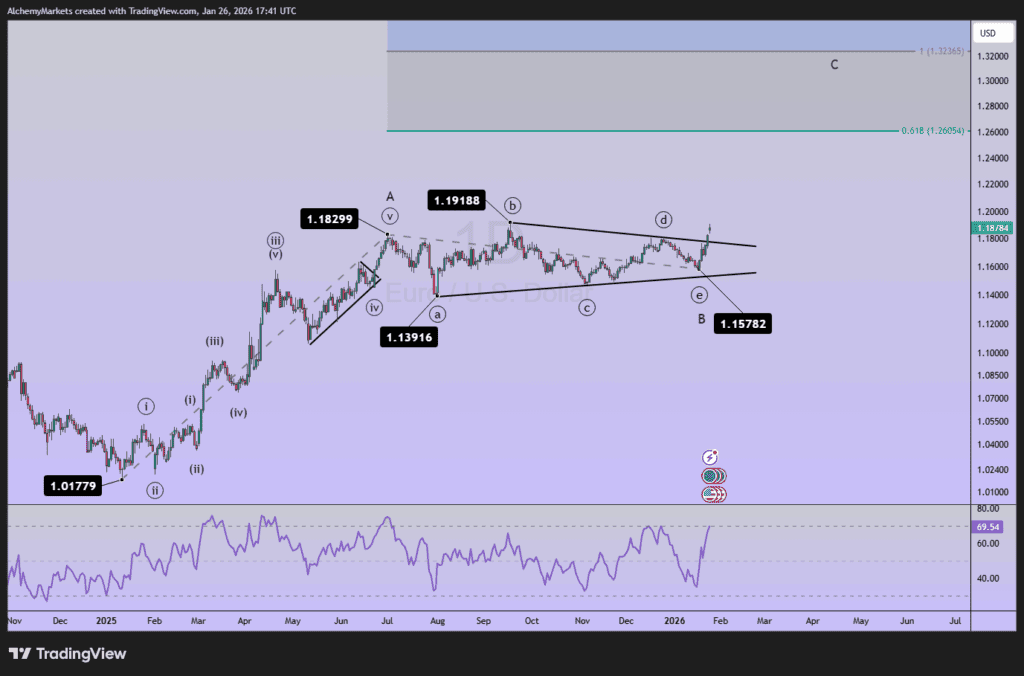
The primary Elliott wave count we are following is a large A-B-C zigzag pattern. The B-wave of the pattern just completed and wave C is rallying higher.
For common technicians, this pattern resembles a large bullish flag pattern. Wave A is the flag pole and wave B is a multi-month symmetrical triangle.
This pattern anticipates a bullish break higher. EUR/USD has begun to break above the topside resistance of the flag pattern near 1.18.
Using the Fibonacci extension tool, we are anticipating the bullish rally to carry up to 1.26 (the 61.8% extension) and possibly 1.32 (100% extension). The 100% extension would be the similar as a ‘measured move’ by projecting the length of the flagpole upon breakout.
The Elliott wave structure we are anticipating for this rally is a 5-wave motive pattern, an impulse or diagonal.
The bullish key level is the January 19 low of 1.1578.
Bottom Line
The obvious Elliott wave count we are following is that a bullish flag pattern is unfolding. The triangle wave is the middle of the pattern and just concluded at 1.1578. This pattern hints a large bullish rally to 1.26 and possibly 1.32 while holding above 1.1578.


