Written by:


- Weekly Outlook
- January 2, 2026
- 4 min read
Powerful Guide to ISM, Building Permits, NFP & Silver Technicals
Next week is important for U.S. markets. We get key economic data that can move stocks, bonds, and the dollar.
The main reports are ISM Manufacturing, ISM Services, Building Permits, and Non-Farm Payrolls (NFP). Traders will watch these closely.
ISM Manufacturing PMI – Monday
The ISM Manufacturing PMI measures activity in factories.
Most forecasts show it staying below 50. That means the factory sector is still shrinking.
If manufacturing comes in weaker than expected, it could push bond yields lower and boost growth-oriented stocks.
The employment part of this report matters too. If factories cut more jobs, it could soften the NFP outlook for Friday.
ISM Services PMI – Wednesday
The services sector is much bigger than manufacturing in the U.S. economy.
The consensus is that the ISM Services PMI will remain above 50, showing expansion.
A strong services number helps calm fears about slowing growth. It would support stocks if it comes in firm.
If the services number weakens, markets could get nervous, especially ahead of NFP.
Building Permits – Friday Morning
Building Permits give a read on future home construction.
Permits below trend can signal weakness in housing. Strong permits support construction-related stocks and economic growth.
Estimates point around 1.3 million permits. If it beats expectations, it helps the cyclical parts of the stock market.
Watch the release time — it can vary by week.
Non-Farm Payrolls (NFP) – Friday
The big number for the week is NFP, released Friday morning.
Consensus estimates are soft — around 50k–75k jobs added. That would be weaker than long-term trend.
Unemployment rate and wage growth are critical. If unemployment rises or wage growth slows, markets may price more interest rate cuts.
If the jobs number is much stronger than expected, yields could rise and stocks may chop.
Market Expectations and Risk Moves
A weak ISM manufacturing print followed by soft NFP is positive for bonds and growth stocks.
A strong services PMI keeps confidence up.
Strong wages or jobs would push yields up and may pressure rate-sensitive sectors.
Permits matter for housing stocks and small cap cyclicals.
In short: soft growth data tends to keep the Fed cutting. Hard data pushes yields higher.
Silver Outlook: Watching the 50 SMA for a Potential Break Lower
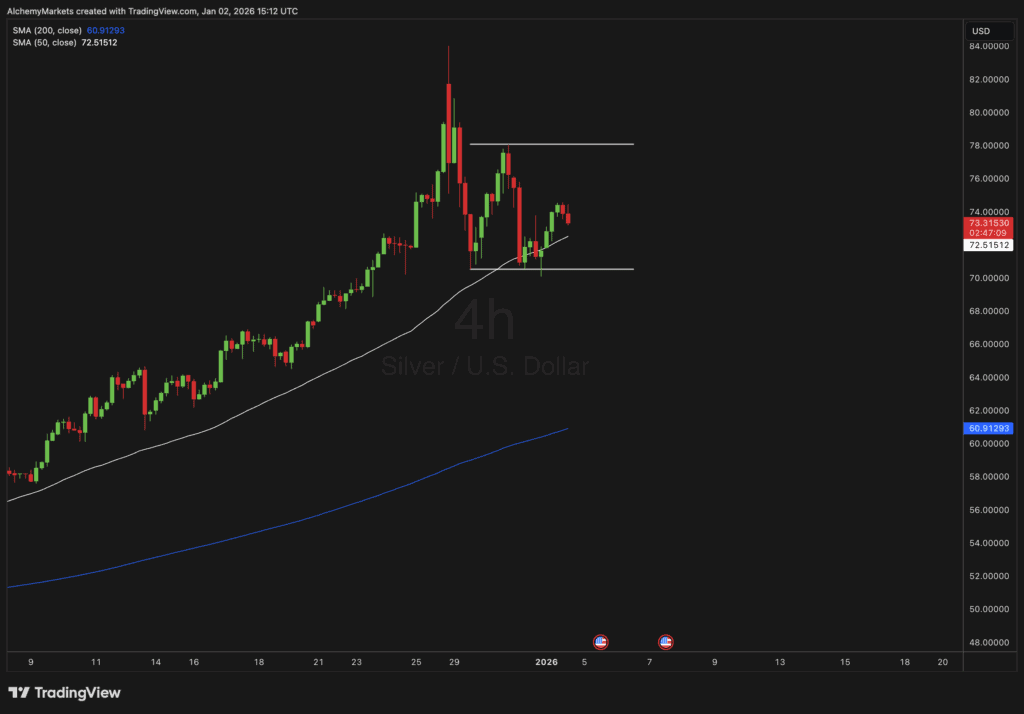
Silver’s rally has cooled off after a strong run through late December. Price has pulled back and is now sitting right near the 50-period simple moving average (SMA) on the 4-hour chart — a key level to watch this week.
Right now, silver looks like it’s trying to hold this short-term support zone. But momentum has slowed, and recent candles show hesitation from buyers. If price breaks below the 50 SMA, that could trigger another leg lower in the near term.
The next major dynamic support sits at the 200-period SMA, which is still trending higher below price. This longer-term average often acts like a safety net for pullbacks inside a broader uptrend. If silver does dip, the 200 SMA might be where buyers try to step back in.
The chart also shows a small range forming between roughly $74.00 resistance and $71.00 support. A clean move below that lower boundary could confirm short-term weakness and open room toward the 200 SMA area around $61–$62.
In short, I’m eyeing silver for a potential push down if the 50 SMA gives way. The trend overall is still constructive, but near-term momentum looks soft. A bounce from the 50 SMA would keep the structure bullish — a break beneath it would likely turn the focus to the 200 SMA as the next dynamic support.
Until then, I’m watching how price reacts right here at the 50 SMA — it’s the line in the sand for the next move.