


Written by:


- Chart of the Day
- December 1, 2025
- 4 min read
EURUSD Awaits Breakout as Daily Compression Meets Weekly Limits
EURUSD is sitting at a technical and macro crossroads. Shorter-term price action shows compression inside a daily triangle, while the weekly structure highlights a larger ascending channel capped by a long-term descending trendline.
At the same time, rate-cut expectations in the United States are building, but incoming data this week will guide how credible that path truly is.
This creates an environment where the outlook is not strongly bearish or bullish, but instead defined by caution and the need for confirmation.
Upcoming US Data to Watch (Dec 1–7)
| Event | Date | Forecast | Market Impact on USD |
| ISM Manufacturing PMI | Mon | ~48.0 | Weak print softens USD. Strong print supports USD. |
| JOLTS Job Openings | Tue | Lower vs previous | Falling openings weaken USD. Surprise rise supports USD. |
| ISM Services PMI | Wed | 51–52 | Above forecast supports USD. Below 50 weakens USD. |
| Unit Labour Costs | Wed | Higher | Rising labour costs support USD due to inflation risk. |
| Nonfarm Productivity | Wed | Mixed | Strong productivity softens inflation pressure and weighs on USD. |
| Factory Orders | Thu | Mild increase | Usually low impact unless a large deviation occurs. |
Daily Chart: Compression Below the 50 EMA and Testing 1-Stdev Bollinger Cloud
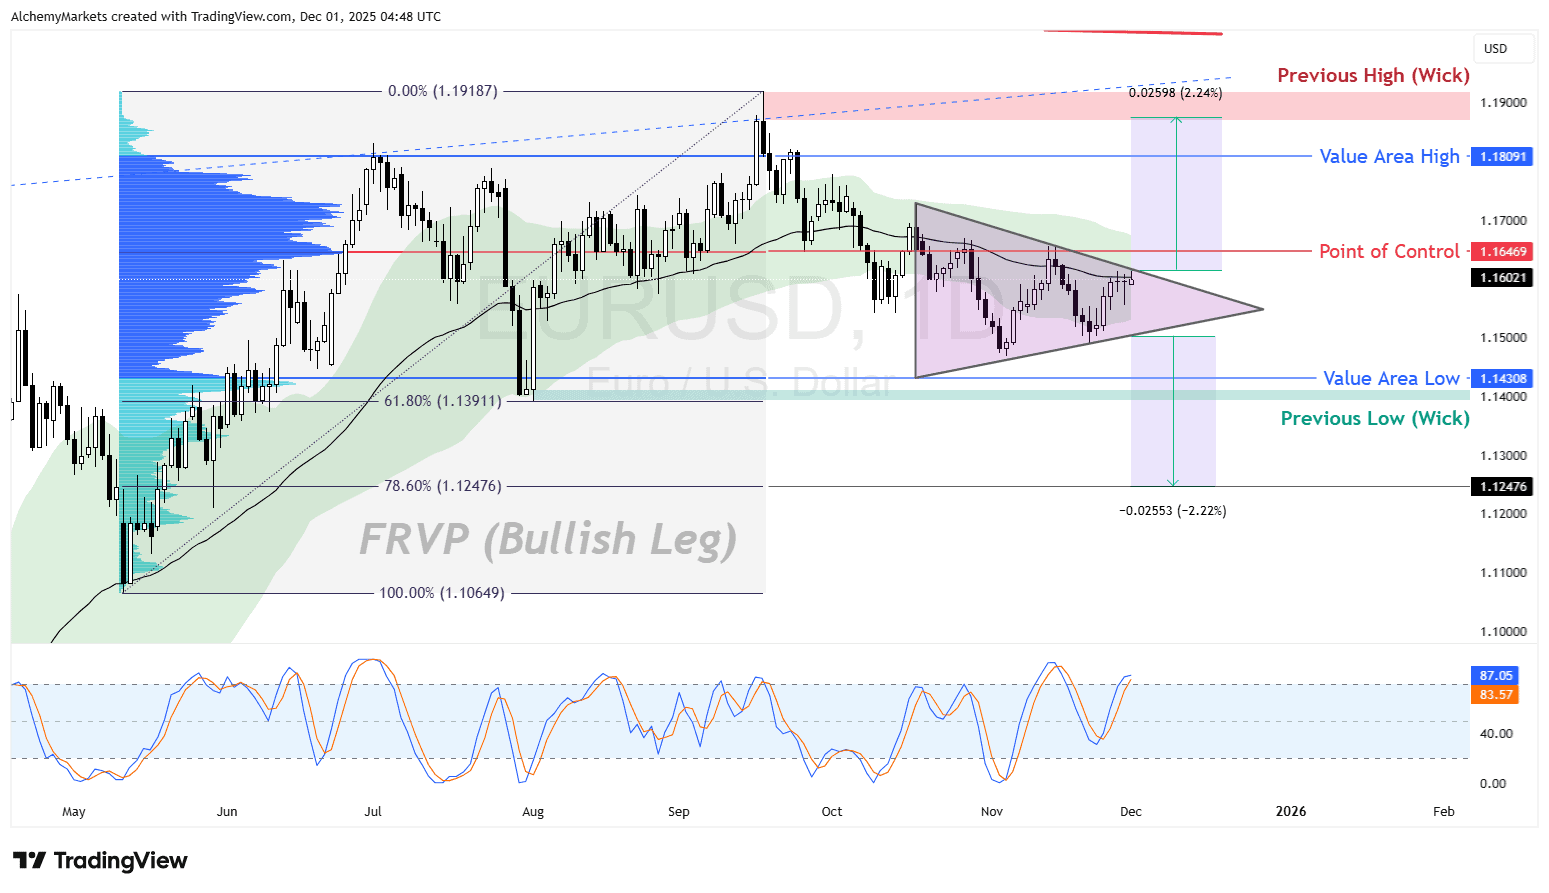
EURUSD is trading within a symmetrical triangle after breaking below the 1D 50 EMA.
We’re using the Bollinger Bands® with 1 standard deviation to capture deviations from the 50 EMA, as long as the price has not broken the upper or lower band, the trend remains intact.
For now, the price has broken down from the bands, which sets our analysed daily trend to short term bearish. But, deviations from the mean have been contained, and the slope of the EMA has softened, which keeps the pair in a neutral stance.
This signals that the market has shifted to a more cautious tone, but has not entered a disorderly downtrend.
Key levels stand out clearly:
- Point of Control (1.1646) is the main overhead test if price attempts a bounce
- Value Area High (1.1809) marks the upper boundary of the previous range
- Value Area Low (1.1430) aligns with clean support and remains the first target if the triangle breaks lower
- The symmetrical triangle itself shows that EURUSD is preparing for a volatility expansion once data hits
Price is sitting just below the EMA midline, so short-term trend pressure leans lower, but the structure still allows for a rebound toward the POC if USD data softens.
Weekly Chart: An Ascending Channel Meets Long-Term Structural Resistance
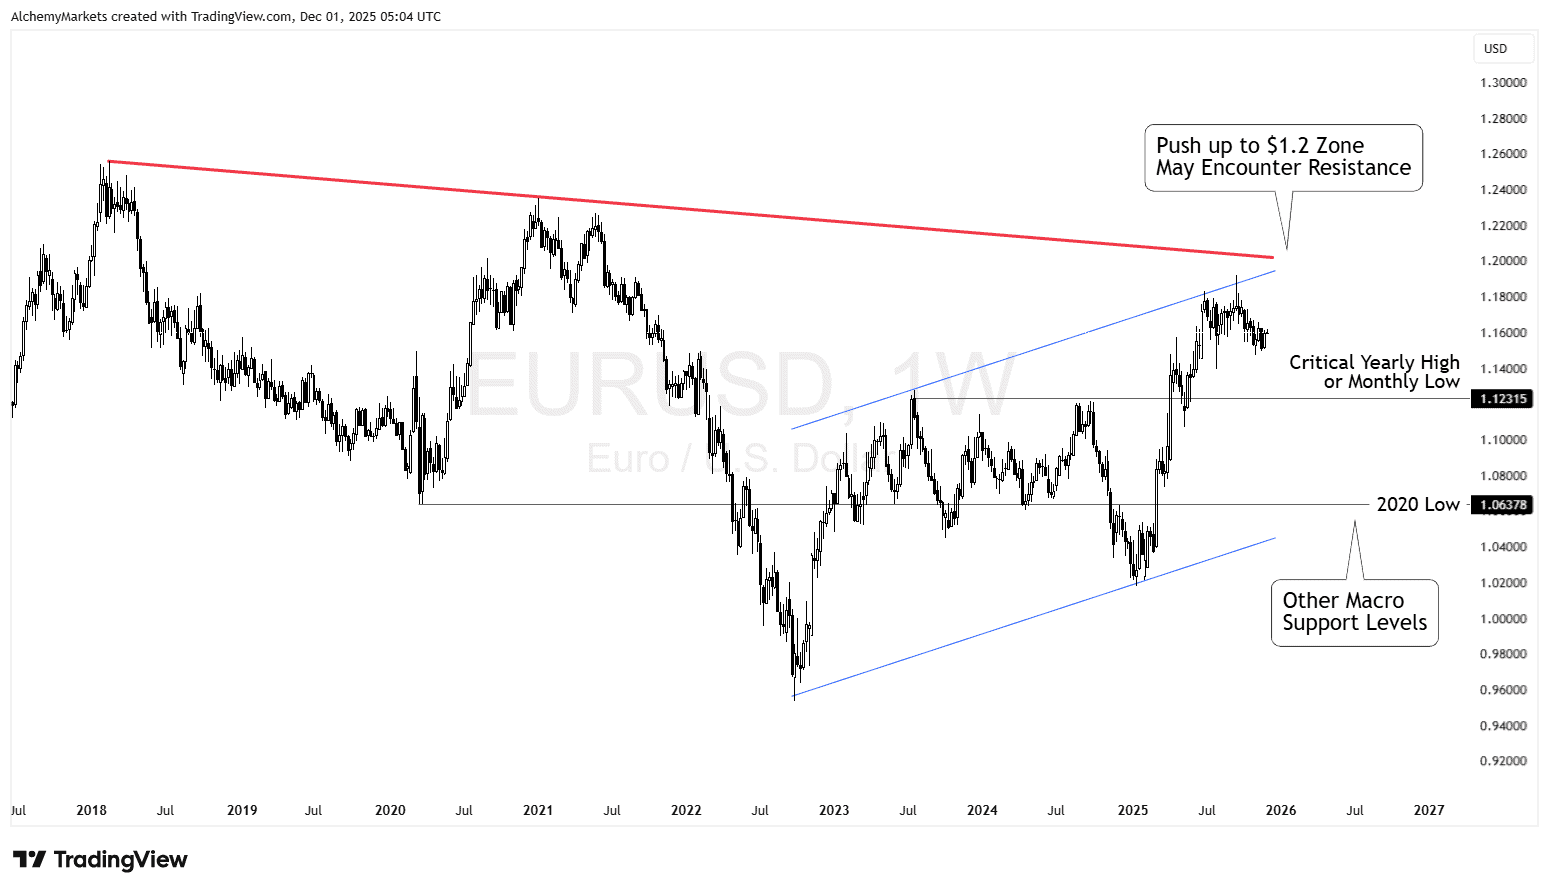
The weekly chart shows EURUSD climbing within a well-defined ascending channel since the 2022 lows.
This shows an improving medium-term tone, but the pair remains capped by a long-term descending trendline from the 2018 highs. The clash between these two structures creates a zone of heavy resistance near the 1.20 region.
Important weekly levels include:
- 1.12 to 1.13 zone, a historical pivot that often acts as a yearly high or monthly low
- 1.0638, the 2020 low which aligns with lows formed in 2023 – 2024
- The 1.95 to 1.20 region, where the channel top meets the descending trendline, forming a potential cap if the pair pushes higher over the coming months
This broader context shows that EURUSD has room to move inside the channel, but meaningful upside requires clearing long-term resistance, which has rejected price multiple times over the past six years.
Macro Environment: Rate Cut Expectations vs Data Sensitivity
Markets are gradually pricing in Fed rate cuts for 2026. This is supportive for EURUSD because a softer USD environment naturally lifts the pair. However, this view still depends on incoming data.
This week brings JOLTS, ISM Manufacturing, ISM Services, and labour-cost figures. These will help determine if the Federal Reserve can maintain a path toward easing or if inflation-linked components remain sticky.
If the data remains firm, the USD can strengthen temporarily, and EURUSD may stay inside the lower part of the daily triangle. If the figures soften, the pair may rebound into the POC and retest upper levels of the compression pattern.
Since the ECB does not have major events this week, the euro remains reactive to USD movements rather than driven by its own catalysts.
Balanced Outlook
Overall, EURUSD sits in a neutral but sensitive zone. The daily triangle shows that momentum is compressing, while the weekly chart highlights significant resistance above and well-defined support below.
The macro landscape leans toward a weaker USD over the medium term, but the near-term trend remains dependent on how this week’s data shifts rate expectations.
Upside moves face layered resistance, and downside swings have clear support levels. With both charts signalling equilibrium rather than a defined trend, patience is warranted until price breaks from the daily triangle or macro data provides a clearer signal of whether the easing cycle is progressing or being pushed back again.


