


- Elliott Wave
- November 13, 2025
- 2 min read
GBP/USD Elliott Wave: Sterling Ready to Shine
Executive Summary
- GBPUSD carved a bullish harami type pattern last week indicating a bullish reversal.
- A completed double zigzag pattern can be counted at the 1.3010 low.
- This might be a major low that leads to a 1700 – 2700 pip rally.
Back on October 23, while trading at 1.3343, we forecasted a decline in GBP/USD to reach 1.3050-1.3139. On November 5, Cable reached a low price of 1.3010. It is possible to consider the correction that began on July 2 complete at last week’s low.
If a major low is in place, then Cable may stage a large rally.
GBPUSD Elliott Wave Count
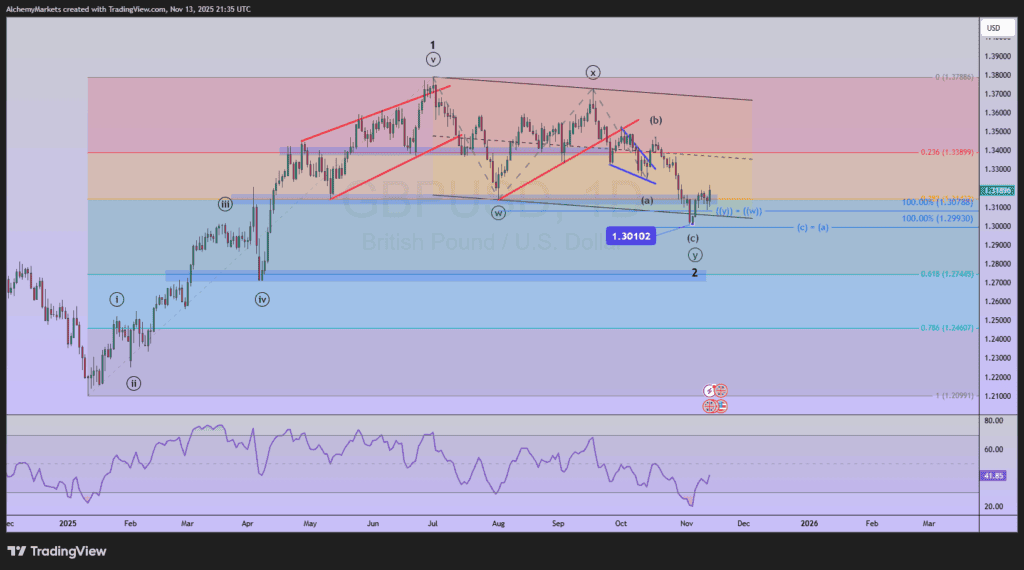
GBPUSD carved a wave ((x)) high on September 17 at 1.3726. The decline since September 17 fits best as wave ((y)) labeled (a)-(b)-(c).
We know from our Elliott wave studies that wave relationships tend to develop between parallel and adjacent waves.
Using the Fibonacci extension tool, wave ((y)) is equal to wave ((w)) at 1.3079.
Additionally, wave (c) of ((y)) is equal to wave (a) of ((y)) at 1.2993.
GBP/USD found a floor in between those levels at 1.3010.
The rally higher from 1.3010, though early, does appear to take on a motive structure. If 1.3010 is an important low, then the next rally would be wave 3, likely to match or have Fibonacci proportions to wave 1 that lasted 1689 pips.
This could drive GBPUSD higher to 1.47 and possibly 1.57.
Bottom Line
GBPUSD may have finished its corrective wave ‘2’ decline at the 1.3010 low. If this is a major low, then a strong and long rally to 1.47 and possibly 1.57 may be underway.
If the 1.3010 support low is broken, then wave ‘2’ is extending lower.


