


Written by:


- Chart of the Day
- July 14, 2025
- 4 min read
BTC Blasts Past $120K — Eyes on $135K After Bull‑Flag Breakout
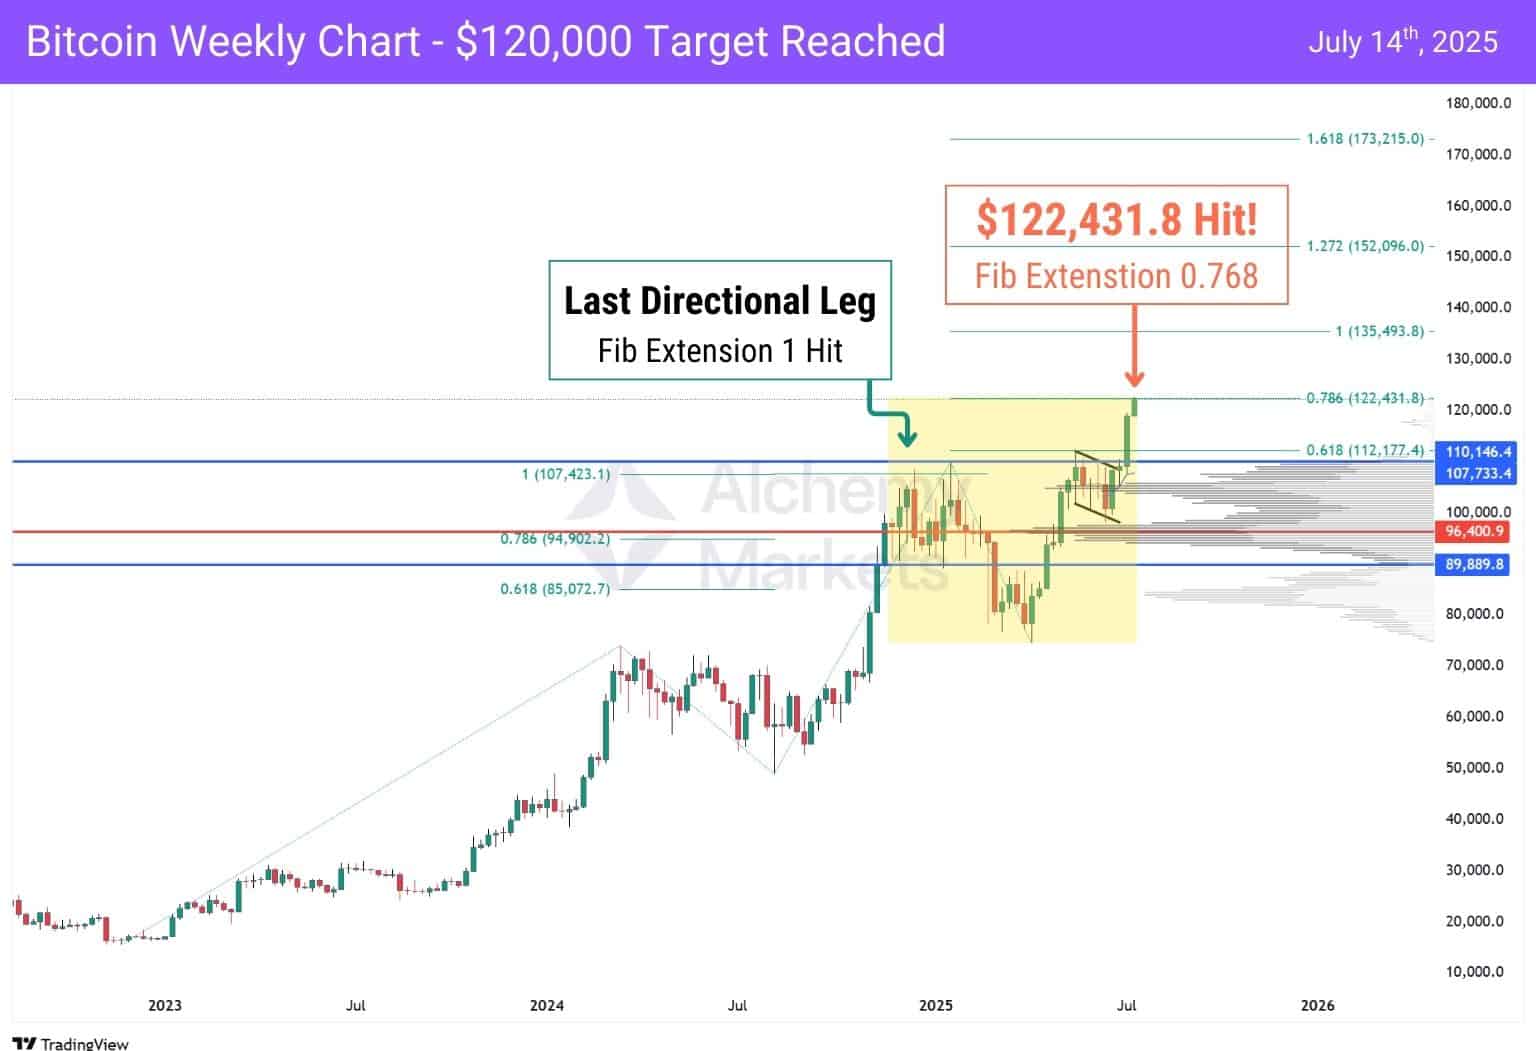
Bitcoin just hit a major milestone — clearing $120,000 for the first time this cycle, and precisely tapping into the 0.768 Fibonacci extension at $122,431.8 on the Weekly Chart. 🚀
Here’s what the crowd is saying.
Market Reaction & Sentiment
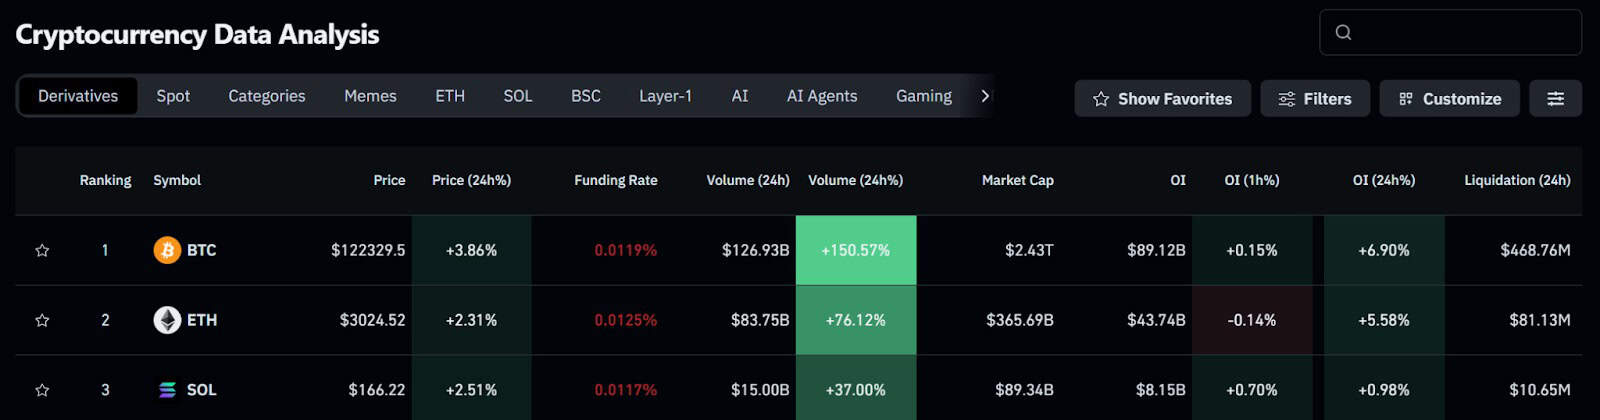
Futures Exchange Data: According to Coinglass, aggregated BTC futures’ 24-hour trading volume surged +150%, while Open Interest (OI) rose +6.90%. Despite this spike, the funding rate remains moderate at 0.0119%, suggesting the rally isn’t overly leveraged yet. 0.05%+ is elevated, and 0.08% is overheated. Nearly $468M in liquidations shows bears are still getting steamrolled.
Macro-momentum connection: Multiple posts on X are citing the 108-day M2 money supply lag—a liquidity signal that often precedes Bitcoin rallies by ~3.5 months. With global liquidity rising, the $120K breakout may have deeper roots than mere hype.
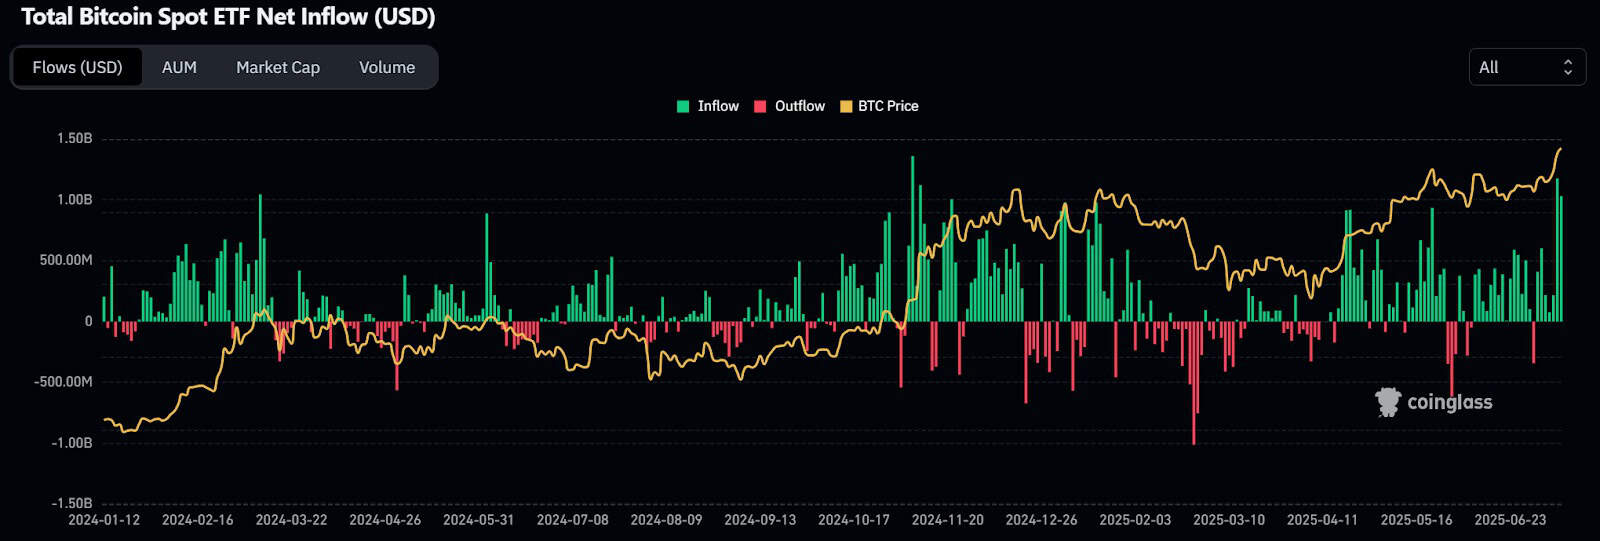
Institutional shift: Traders on X note that large wallets have stopped shorting aggressively. Chatter suggests institutions are closing bearish bets and repositioning for upside — likely eyeing the next Fib zones around $135K–$140K. Bitcoin Spot ETF inflow data from Coinglass supports this shift (updates a new bar every 24h), showing renewed demand from institutional buyers.
Are We Due for a Retrace or Onward Surge?
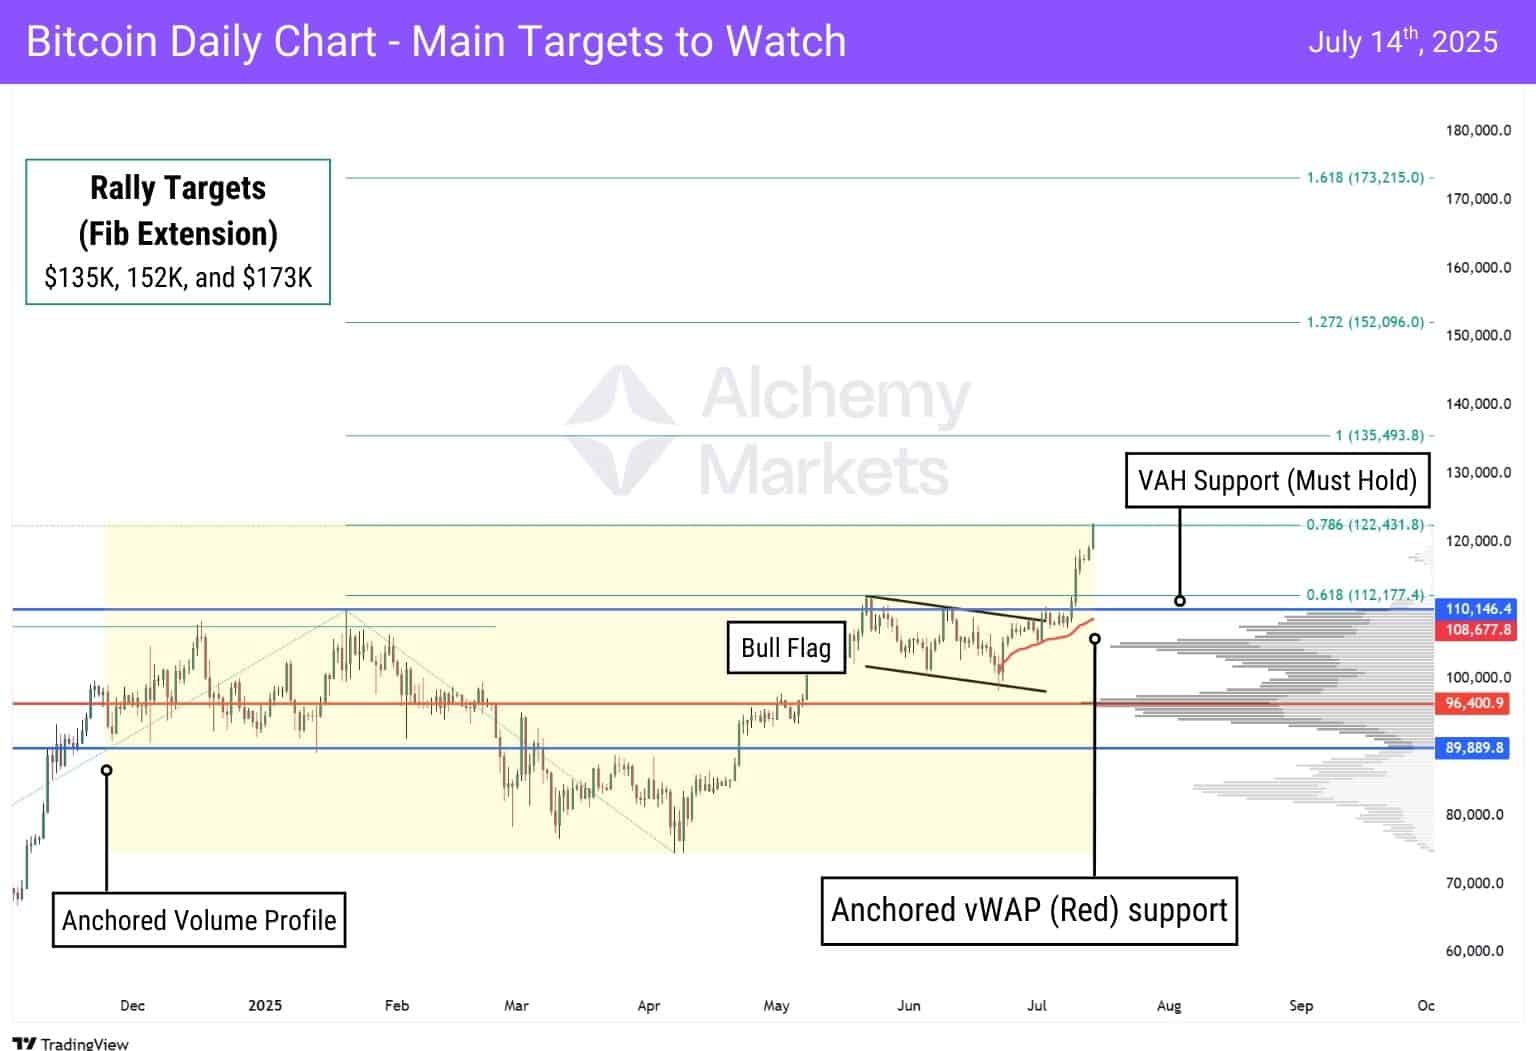
Bitcoin just tagged the $122,431.8 Fib extension (0.768), breaking out of a well-defined bull flag pattern shown on the Daily Chart. This marks a major technical milestone—but also raises the question: is this the start of a larger leg up, or are we due for a pause?
📈 Bullish Case – Continuation Higher
- Price cleanly broke out of the bull flag and surged above the VAH zone near $120K.
- Anchored VWAP and volume profile show healthy support near $110K–$112K.
- Fibonacci targets point to $135K, $152K, and $173K if momentum holds.
- Breakout is supported by steady ETF inflows and continued short liquidations.
- Sentiment across X and derivatives platforms leans bullish, but not euphoric.
📉 Retracement Risk – Healthy Pullback?
- Bitcoin just hit the 0.768 Fib extension ($122,431.8), a key target from the last directional leg.
- Momentum may pause as RSI sits in elevated territory and volume shows signs of fading.
- This is a logical zone for some profit-taking and potential consolidation.
🧱 Key Support Levels to Watch
- $113K–$110K: Anchored VWAP + Value Area High zone, possible long entry if price pulls back.
- $107K zone: Broader range structural support with massive High Volume Node, below this weakens the bullish case.
Where are we in terms of topping out?
Bitcoin’s recent rally smashed into $120K, a level many traders had their eyes on. While this move was expected by those tracking the bull flag breakout and Fib extensions, it also lands Bitcoin within a historically sensitive area for local tops.
We’re referring, of course, to the Weekly Logarithmic Regression Curve, a tool we’ve highlighted in previous analyses.
Applied to the BLX (Bitcoin Liquid Index) on the weekly, logarithmic scale, this curve has served as a powerful top indicator in the past four major Bitcoin cycles since 2010.
- 🟨 Weekly Log Curve Chart: BTC is now approaching into the 1st upper boundary of the long-term log growth curve, at $123,885.51. Historically, this region acts as a resistance band where major rallies often pause or reverse.
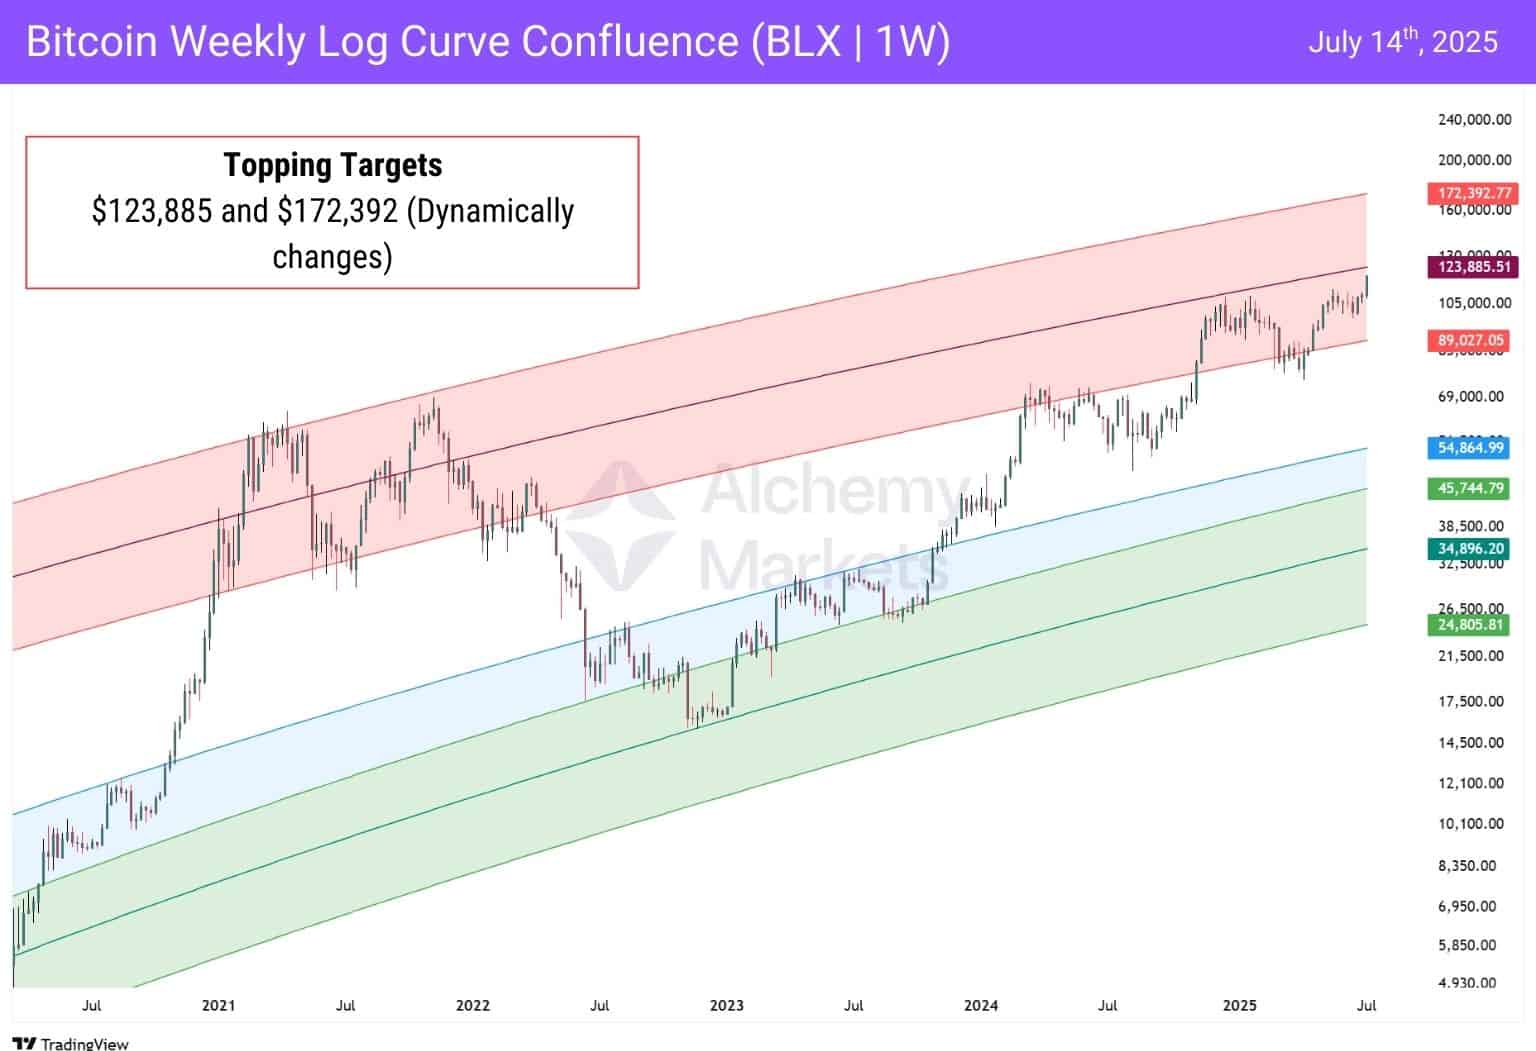
Here’s what the charts tell us:
- 🧭 First zone of potential rejection: $123K–$125K range (where price currently sits).
- 🎯 Upper limit projection: $172K, which matches the third and final Fib extension target on the Daily and Weekly charts.
- 🕰 Timing vs Position: This 1st outer band has previously marked mid-cycle stalls, as well as full-blown cycle tops. However, we have not yet tested this zone, and Bitcoin futures data also suggest BTC is not yet at peak euphoria.
So no, this isn’t the clear macro top, but it could be a spot where profit-taking accelerates or momentum slows before the next leg higher.
In the worst case scenario, we retrace and the price breaks below $96,000 (point of control). This would then be a real cause for concern, but appears to be unlikely for now.
You may also be interested in:


