


Skriven av:


- Quarterly Forecast
- december 30, 2025
- 8 min läsning
Q1 2026 Equity Outlook: Trends Intact, Sensitivity Rising
Q1 2026 sits at a point in the market cycle where many of the obvious questions have already been answered. Inflation is no longer accelerating, the Federal Reserve is no longer tightening aggressively, and recession fears that dominated prior years have eased.
What remains unresolved is how much growth is left, how patient policy will be, and how markets behave once relief has been priced in.
This outlook focuses on that transition. Not on calling a top, but on understanding where optimism remains justified and where risks are quietly building beneath the surface.
What does that mean for equities in the first quarter of 2026?
The Big Picture: Policy and the Unwind Story
The macro backdrop has moved beyond crisis avoidance and into second-order effects. Markets are increasingly focused on the idea of a potential yen carry trade unwind, especially as US policy turns more accommodative and Japanese yields rise.
That concern is not baseless, but it is also being overstated by many traders.
At this stage, there are no technical indications that a systemic unwind is unfolding. Price action across equities, volatility, and credit markets does not confirm crisis conditions. What we are seeing instead is heightened sensitivity to a risk that traders know exists, but cannot yet see.
In other words, the fear is visible, but the damage is not.
This creates an important distinction for Q1 2026:
- Policy shifts remain supportive for risk assets
- Price trends remain constructive
- Markets are becoming more reactive to underlying funding risks
The prevailing mode is therefore cautiously bullish, not complacent. Participation remains justified, but awareness matters more than it did earlier in the cycle.
To understand why this risk is being talked about at all, we need to look at Japanese yields.
Japanese Yields: Why the Market Is Watching Closely
Before diving into our equities analysis, let’s first set the big picture.
For years, Japanese bond yields barely moved. That made the yen cheap to borrow and easy to sell, which helped fund global risk trades across equities, credit, and commodities.
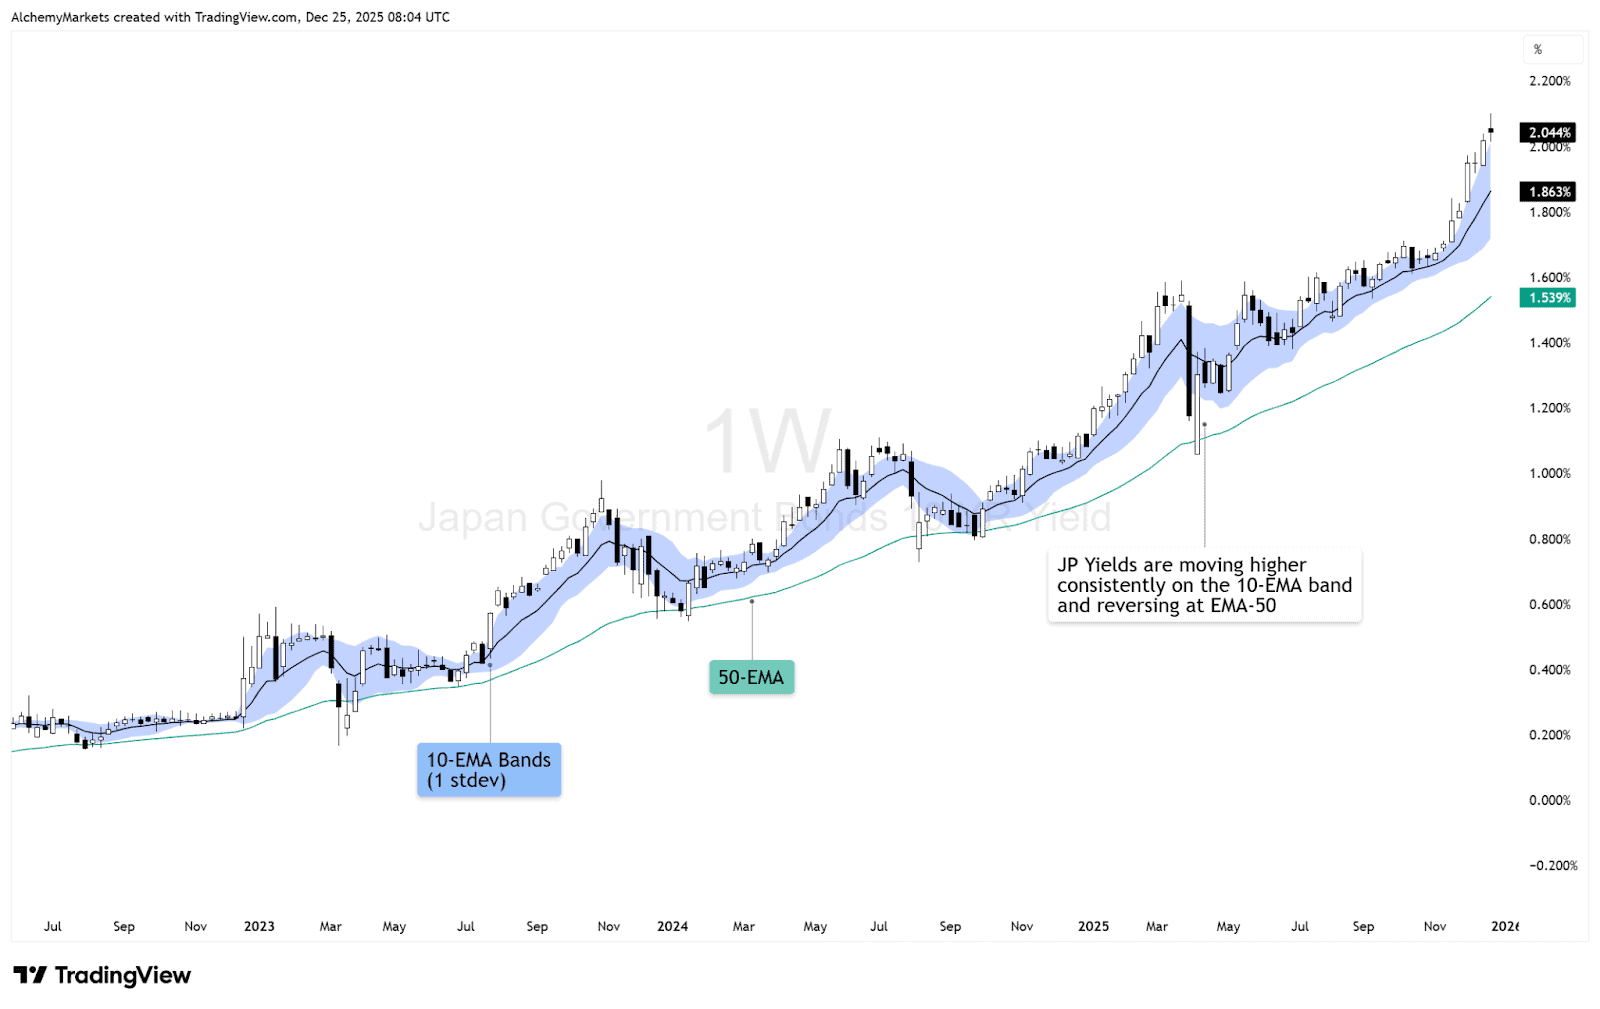
That regime has clearly changed in 2025. Japanese 10-year government bond yields have risen to their highest level in over a decade, pushing above key technical levels and trending firmly above the 10-EMA. This is not a short-term spike. It reflects a structural shift away from extreme yield suppression.
What the magnitude tells us:
- Yields are no longer anchored near 0-1%
- Funding conditions tied to the yen are slowly tightening
- The era of frictionless yen borrowing is fading
This explains why traders are alert. However, it is important to be precise.
Historically, carry trade stress only becomes destabilising when yield moves are fast, disorderly, or policy-forced, particularly in correlation to the US 10 Year Yields.
If we take a look at the US 10 year yields MINUS Japanese 10 year yield chart (Weekly timeframe), the context becomes obvious:
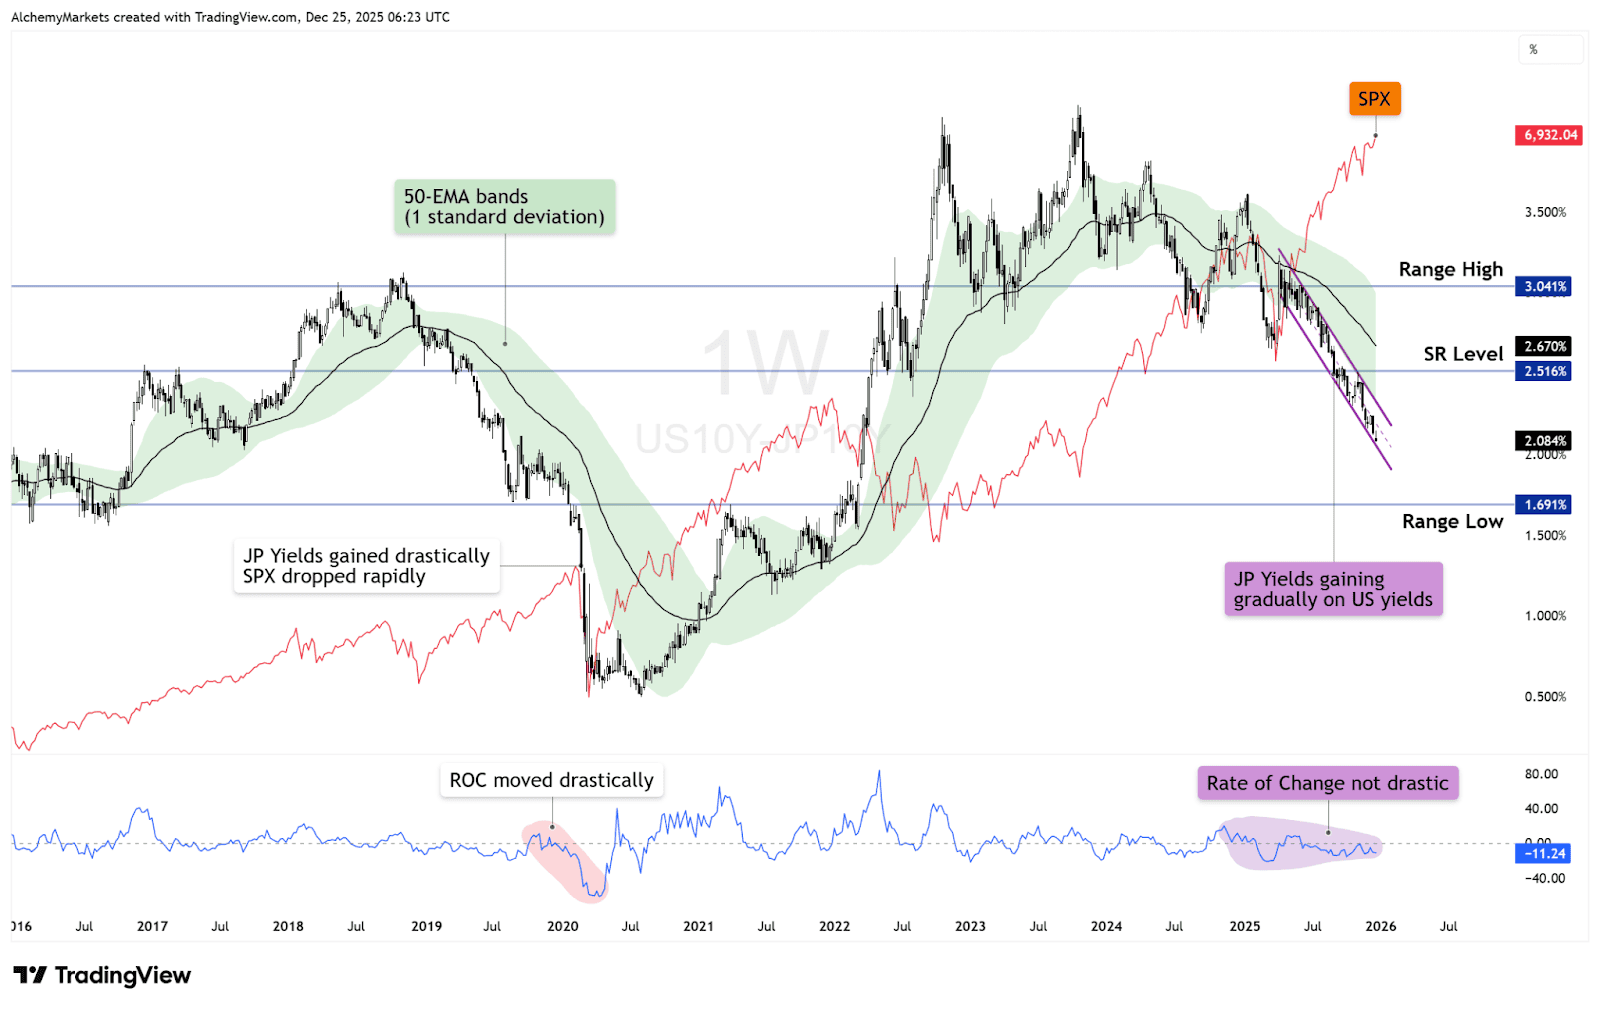
Notice how the S&P 500 typically suffers sharp drawdowns only when US yields collapse rapidly against their Japanese counterparts.
| The 2020 Comparison: In the first highlighted section, the Rate of Change (ROC) moved drastically. As Japanese yields gained ground rapidly, the SPX experienced a sharp, vertical drop.The 2025 Context: Current data shows a different story. While Japanese yields are gaining, the transition has been gradual and technically orderly. The ROC is currently stable, rather than impulsive. |
Therefore, the implication is not an imminent crisis, but reduced tolerance for excess leverage. Risk-taking adjusts before it unwinds. That is the phase markets are currently in.
US Yields: Policy Relief Without Acceleration
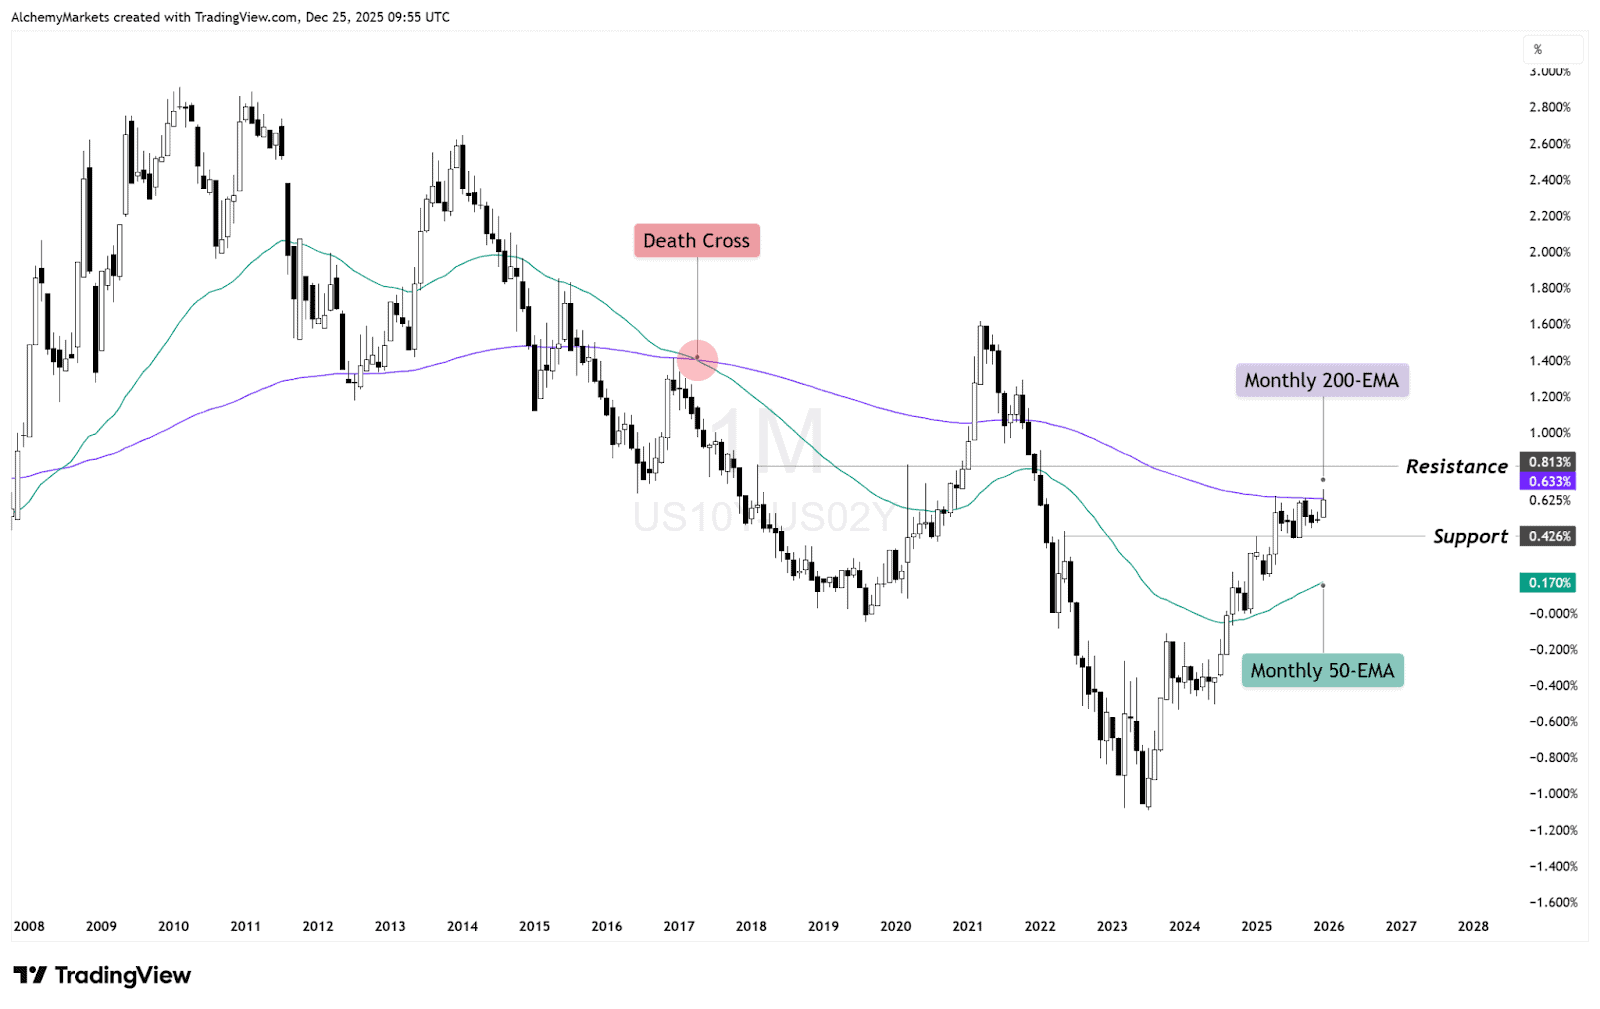
US yields reinforce this interpretation. The 10Y–2Y spread on the monthly chart suggests the most restrictive phase of policy is behind us. The curve has begun to normalise, signalling easing pressure rather than renewed stress.
For traders, this means:
- The Fed is no longer tightening into weakness
- Policy relief is already reflected in asset prices
- Future gains depend more on earnings and positioning than on rates
Lower policy stress supports equities, but it does not eliminate funding risks elsewhere. It simply prevents those risks from becoming acute.
From a technical perspective, the spread is approaching overhead resistance near the 200-EMA on the monthly chart, which could lead to a temporary pause (consolidation), or in the worst case, rejection.
That said, the policy transition toward easing is now underway, so a harsh rejection is unlikely. The remaining question for 2026 is not if but when and how quickly rates are cut. Move too quickly, and funding markets, particularly yen-based carry trades, may react abruptly.
S&P 500: Trend Intact, But Less Forgiving
The S&P 500 remains the anchor for global risk sentiment. Here we have the S&P 500 (CFD: US500 on Alchemy Markets) daily timeframe, with volume-profile based trading levels.
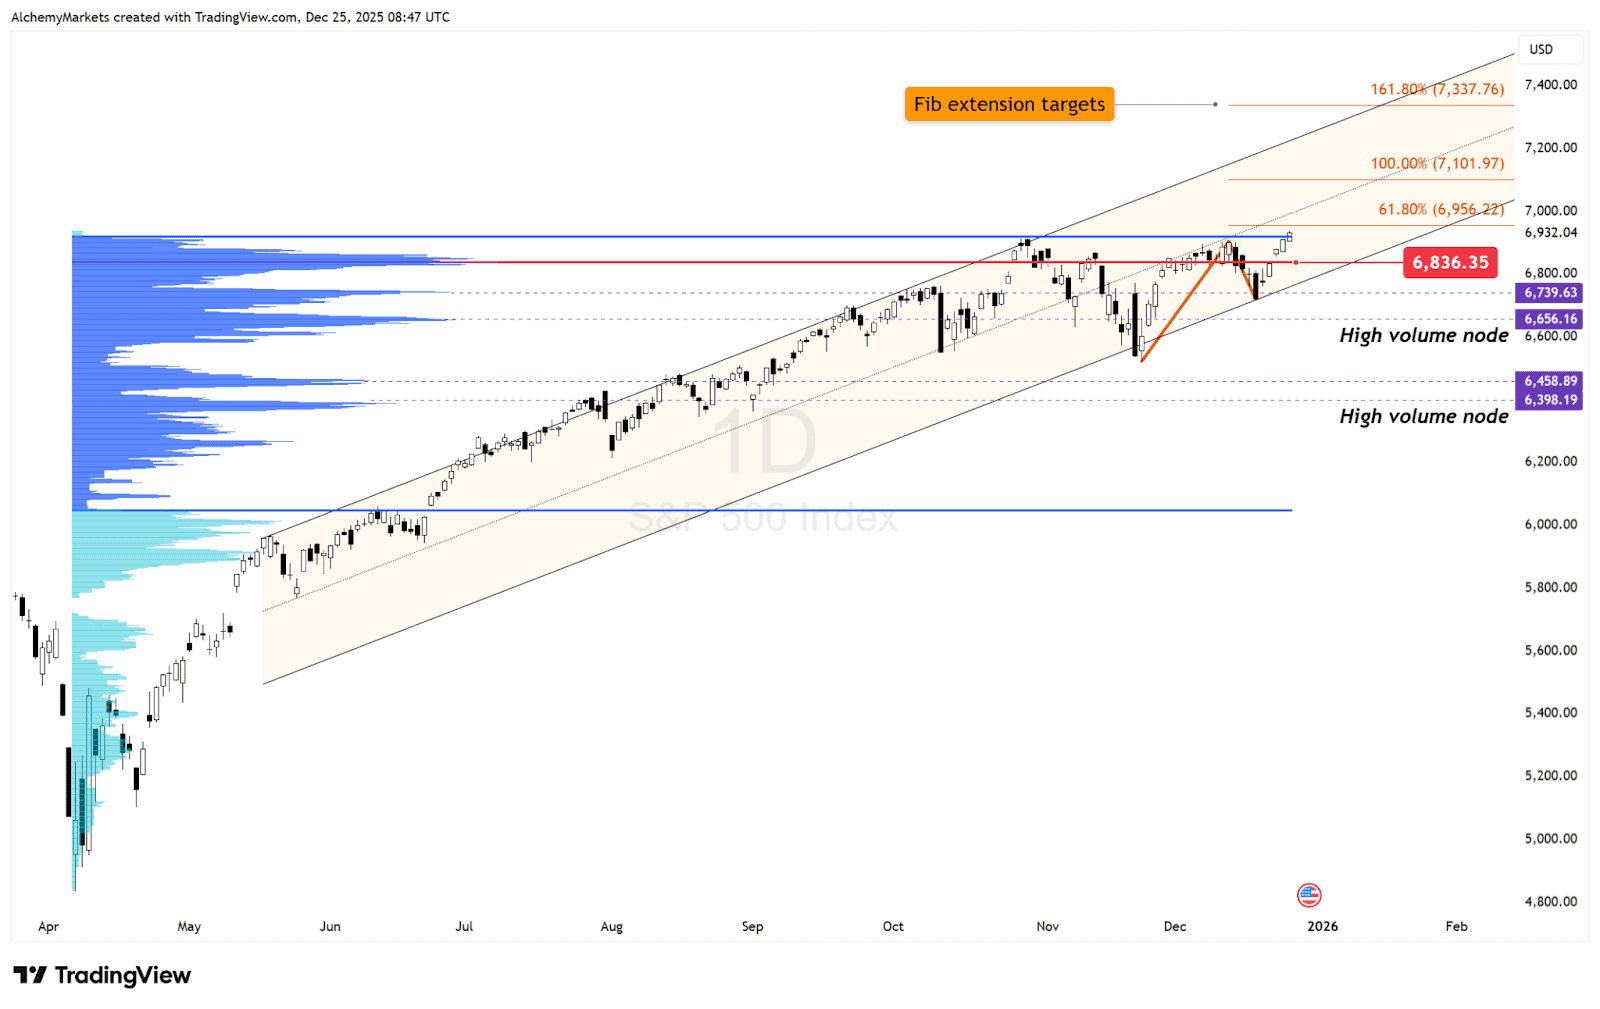
From the chart, the message is straightforward:
- The broader uptrend remains intact
- Pullbacks continue to resolve within structure
- There is no technical evidence of trend failure
However, the character of price action has changed.
Momentum has cooled, and gains are becoming harder-earned. This is consistent with a market that has already priced policy relief and now requires confirmation through earnings and participation.
Possible outcomes in Q1 2026:
- Continued grind higher within the existing trend
- Shallow pullbacks that reset positioning
- Faster reactions to macro or earnings surprises
The S&P is not signalling danger. It is signalling maturity (end of cycle behaviour).
Nasdaq: Leadership Fatigue and Rotation Risk
The Nasdaq presents a more fragile picture. Here we have the Nasdaq (CFD: USTEC on Alchemy Markets) daily timeframe.
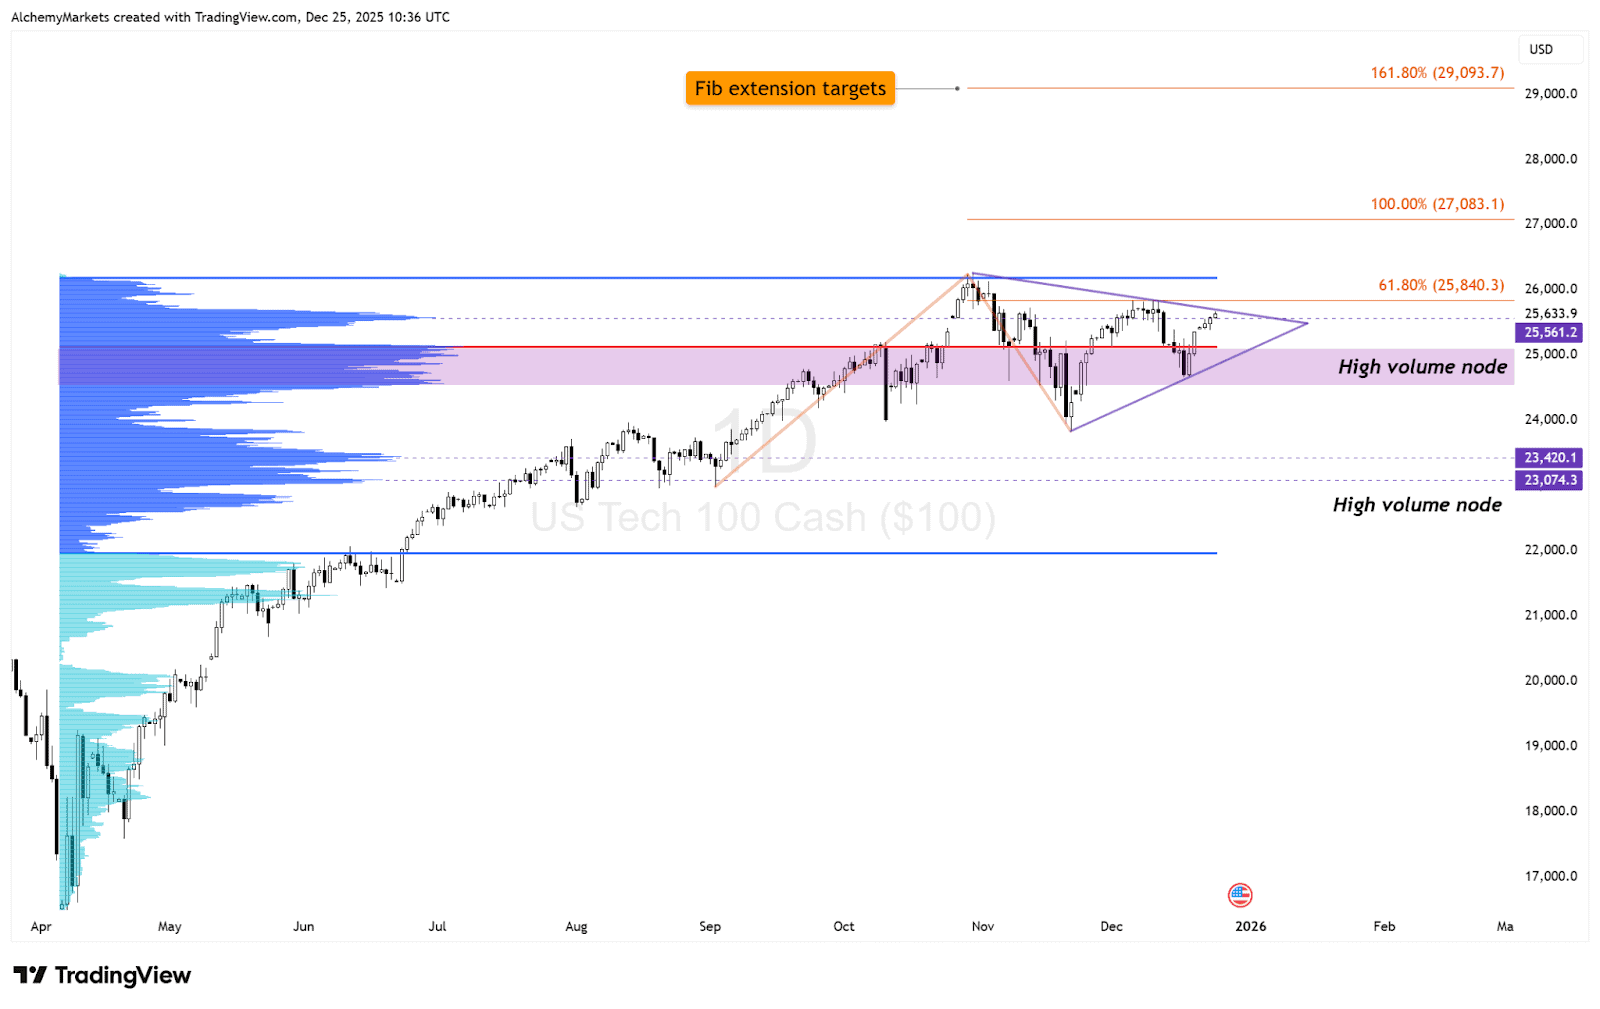
While price has not broken down, the chart shows:
- Repeated hesitation near highs
- Consolidation within a Symmetrical Triangle
This reflects leadership fatigue rather than outright risk aversion. Moving into Q1, traders should be aware of Nasdaq’s increased sensitivity to earnings and positioning
Large-cap growth has carried the market for much of the cycle. As funding conditions tighten slightly and policy becomes less of a tailwind, that leadership is being challenged.
For Q1 2026, this means:
- Nasdaq outperformance is no longer guaranteed
- Earnings matter more than narratives
- Crowded positioning increases downside sensitivity
Importantly, weakness here does not automatically translate into a bearish market. It signals rotation within equities rather than a broader retreat from risk.
Dow Jones: Quiet Confirmation of Risk Appetite
The Dow continues to play a confirming role. Here we have the Dow Jones (CFD: US30 on Alchemy Markets) daily timeframe.
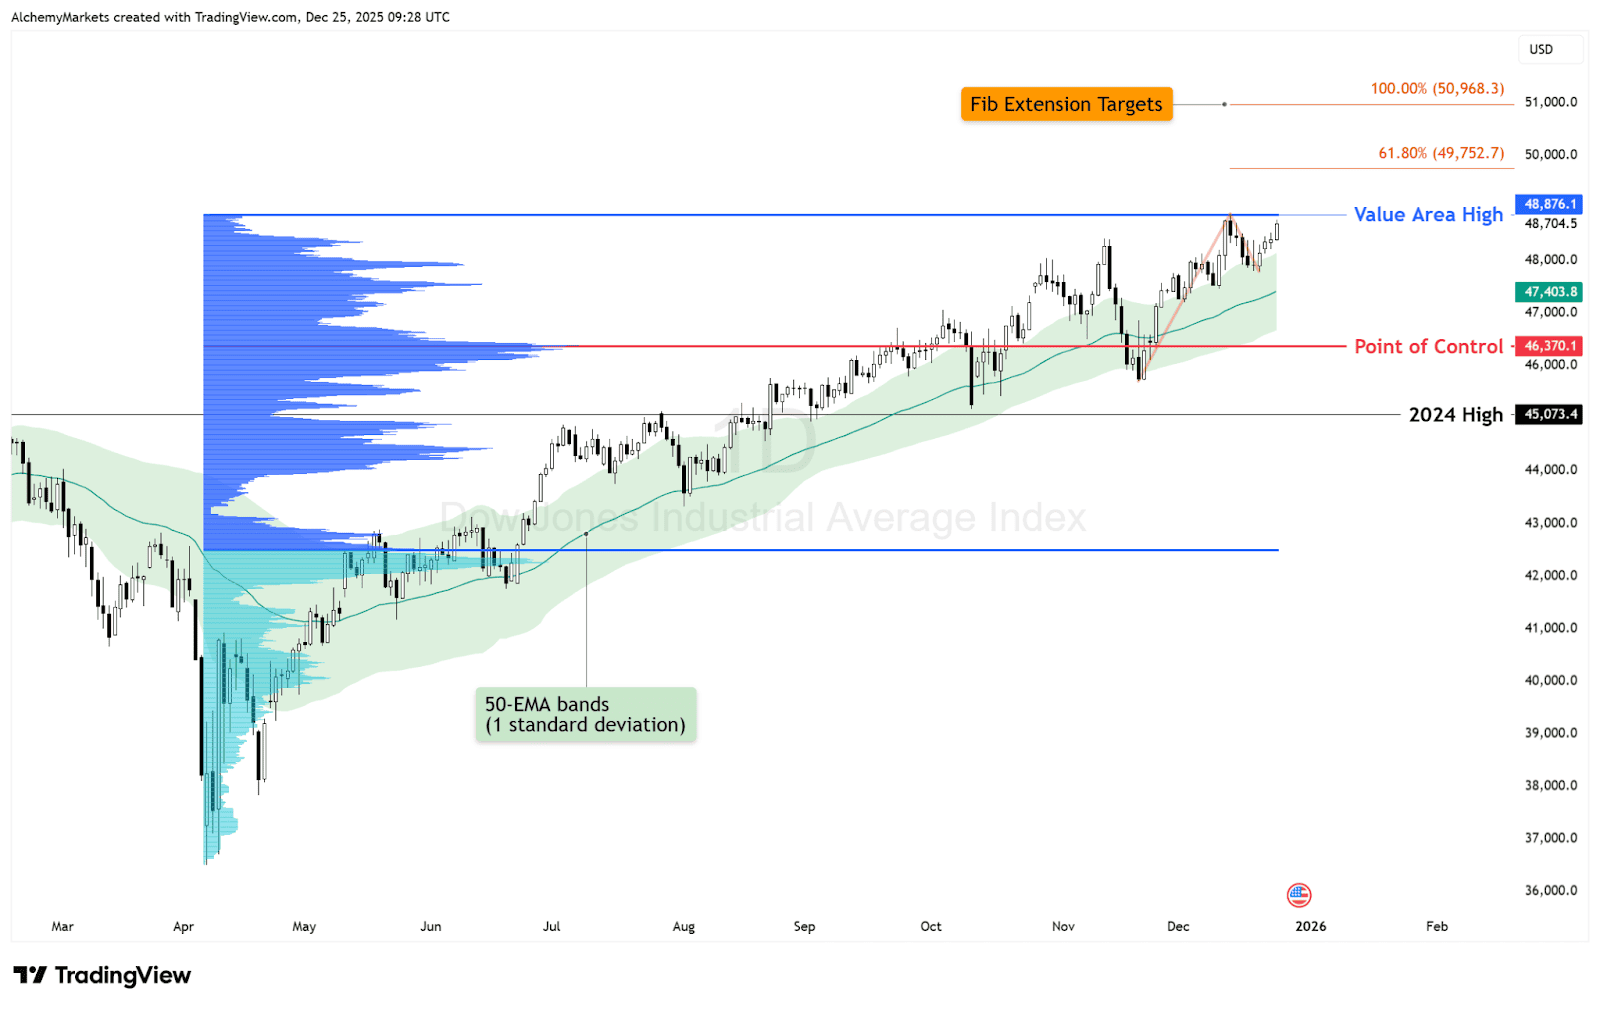
From a technical perspective:
- Trend support remains clean
- Breakouts have held rather than failed
- Price behaviour suggests accumulation, not distribution
The Dow’s healthier Q4 performance compared to the Nasdaq points to rotation within the market, consistent with late-cycle behaviour.
Rather than a broad risk-off move, investors appear to be shifting away from rate-sensitive tech leadership toward areas offering cash flow stability and valuation support.
For Q1, this means:
- Continued relative outperformance if rates remain stable
- Sideways consolidation as rotation matures
- Pullbacks that remain technically healthy while trend support (50-EMA bollinger bands®) holds
As long as the Dow holds its structure, it reinforces the idea that risk appetite remains present, even if it is being expressed more selectively.
DAX: Constructive, But Externally Dependent
European equities remain constructive, but less self-driven. Here we have the Dax (CFD: DE30 on Alchemy Markets) weekly timeframe.
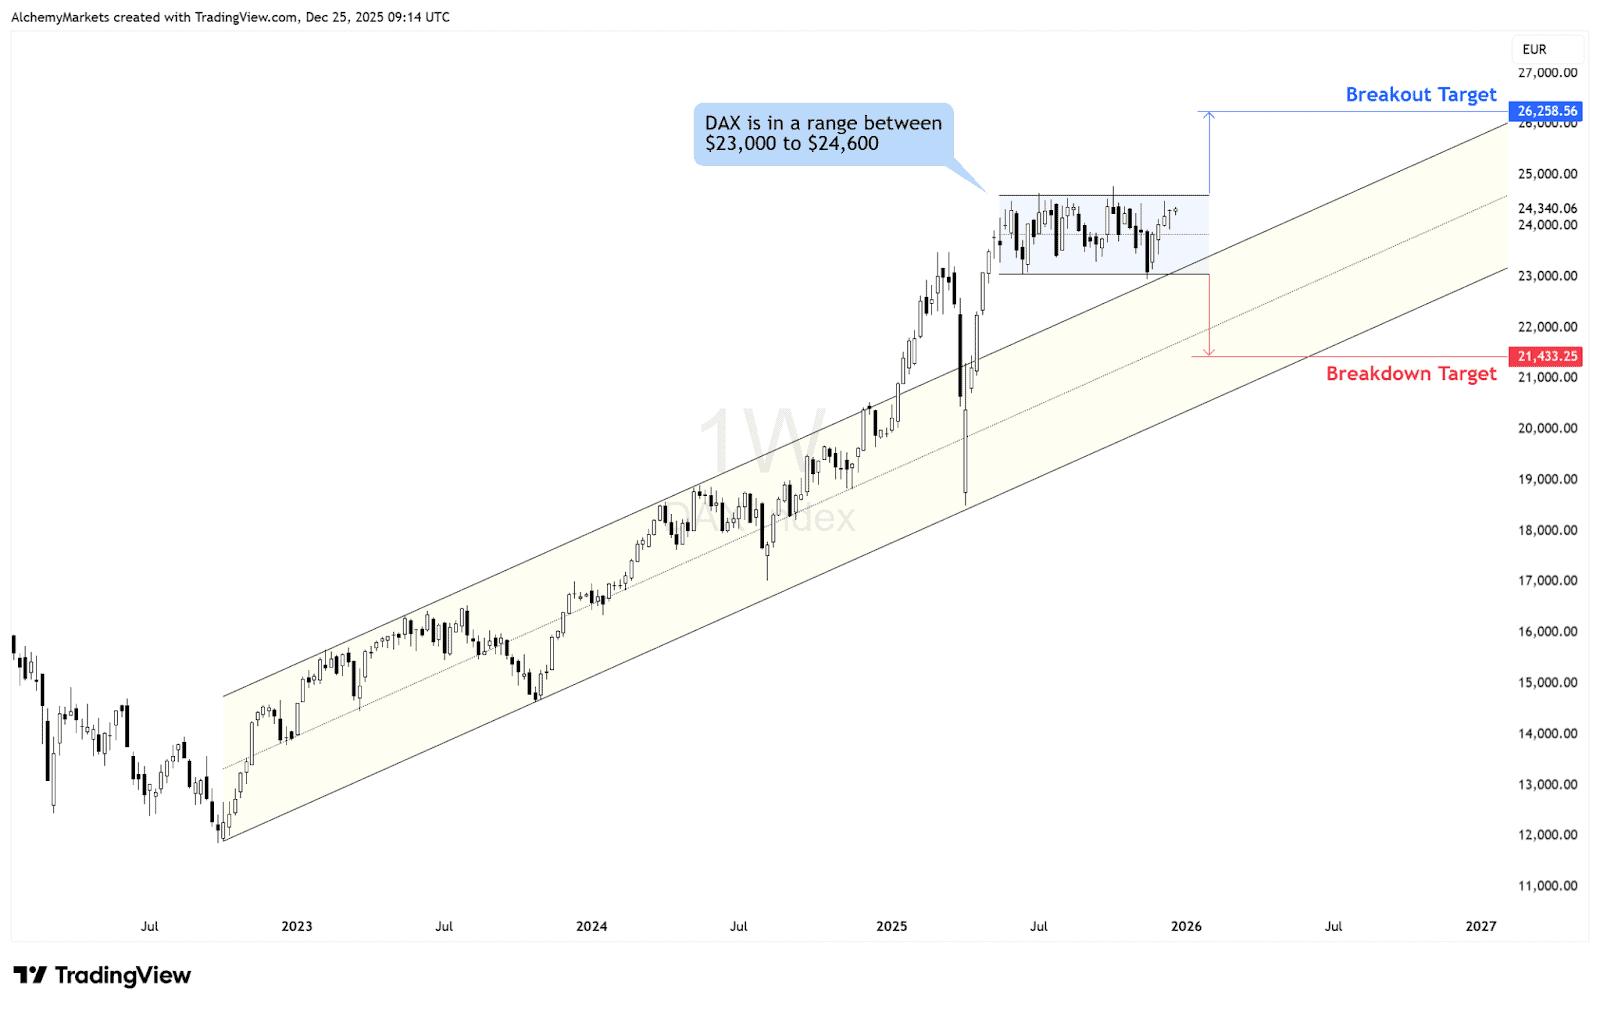
The DAX chart shows:
- A clear rising structure
- Consolidation near upper ranges
- Well-defined support and resistance zones
This suggests participation in the European markets without excess enthusiasm.
Possible outcomes in Q1:
- Upside continuation if global risk sentiment stays constructive
- Range-bound movement near highs
- Sharper reactions to external macro or FX shocks
Europe benefits from global risk stability and easing financial conditions, but remains more exposed to external shocks. The trend remains valid, but the conviction is conditional.
Basically, watch the range until it breaks.
FTSE: Defensive Strength, Limited Momentum
The FTSE reflects the defensive side of global rotation. Here we have the FTSE (CFD: UK100 on Alchemy Markets) daily timeframe.
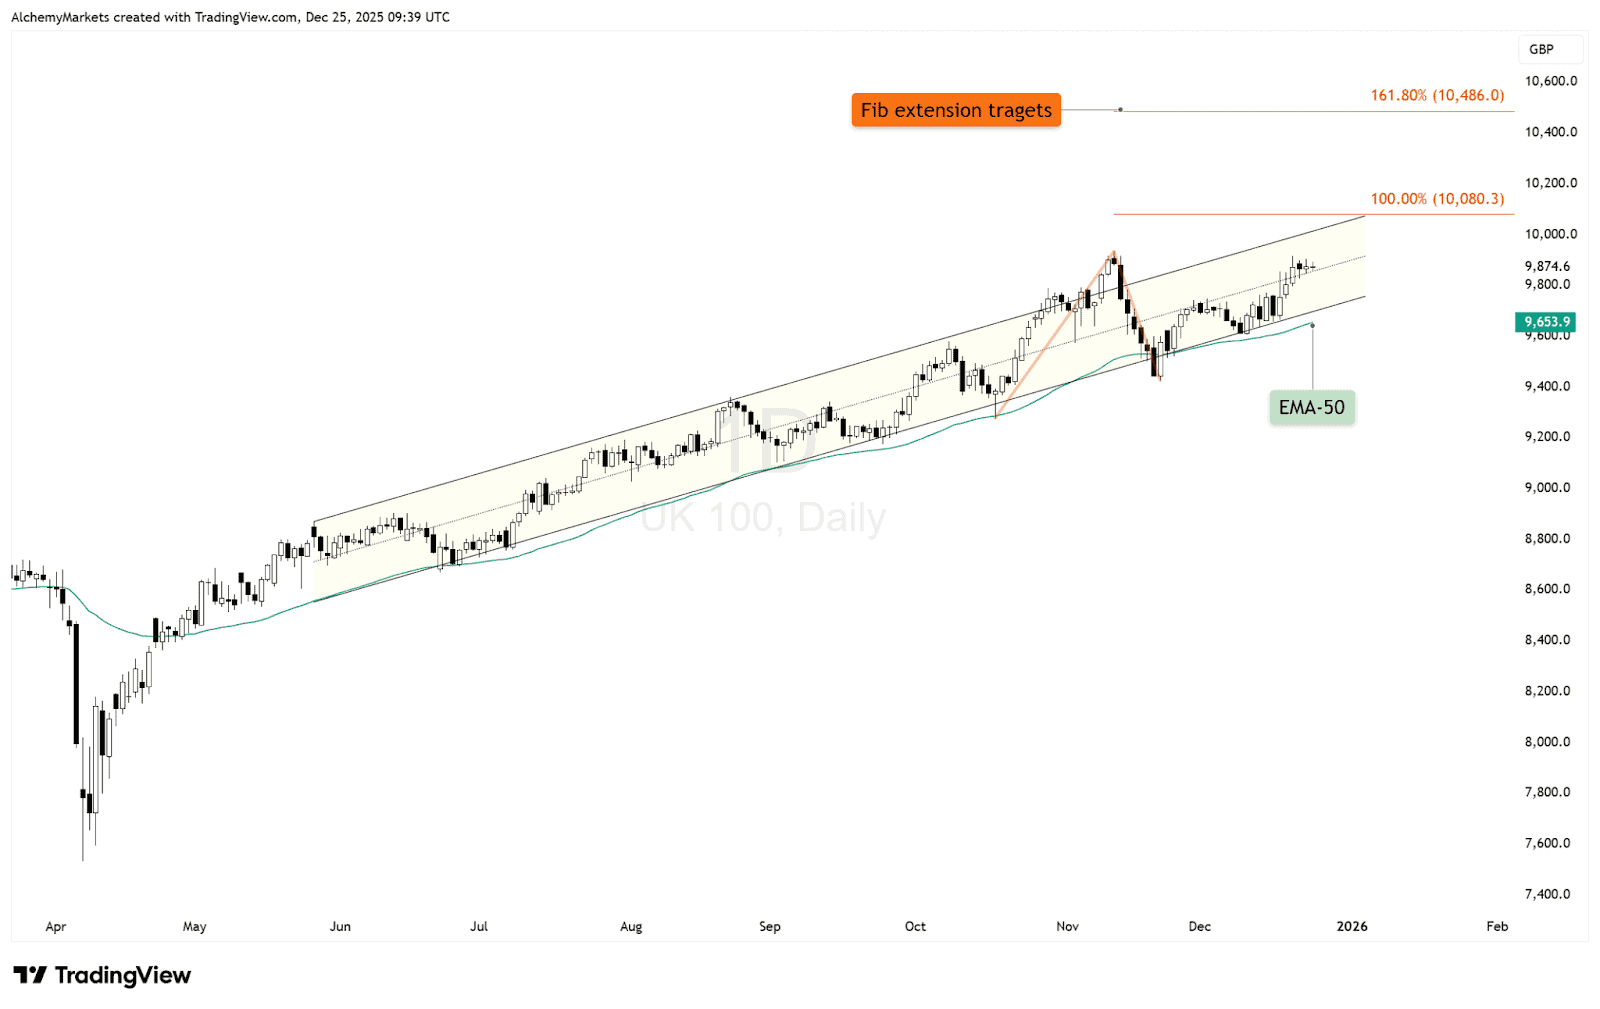
Technically:
- Trend structure remains orderly
- Pullbacks continue to be bought
- Upside momentum is steady rather than explosive
Possible outcomes in Q1 2026:
- Gradual grind higher driven by defensive flows
- Consolidation beneath psychological resistance
- Relative stability during periods of broader equity volatility
This index acts less as a driver and more as a stabiliser, consistent with an environment where investors value resilience over growth optionality.
Macro / Cross-Market Summary
Across yields, equities, and volatility, the signals are aligned.
- Macro bullish trends remain intact
- Credit and volatility markets do not confirm crisis conditions
- Funding risks are present, but not acute
As Q1 begins:
- Portfolio rebalancing resets positioning
- Options hedges are rolled or unwound
- Earnings guidance and policy expectations regain influence
This often pulls volatility forward into early Q1, even within broader uptrends. The key takeaway for Q1 2026 is not imminent breakdown, but heightened sensitivity to surprises.
Markets can still move higher, but they are simply less forgiving of mistakes (more fragile).
Our stance remains cautiously bullish, supported by policy shifts, while staying alert to the risks building quietly in the background.


