


- Elliott Wave
- maj 1, 2026
- 2 min läsning
Equal Wave Pattern Points At Short Term Dip (Elliott Wave)
Executive Summary
- Crude oil reached $110.93 then fell back to $99.30
- The decline has a distinct equal wave pattern that points to eventual new highs above $111
- The next rally may be a false rally to set up a sweep of the lows.
Crude oil topped at $110.93 and has corrected lower in an Equal Wave pattern. This pattern suggests an eventual rally to new highs above $111. But first, the decline may be incomplete.
Current Elliott Wave Analysis
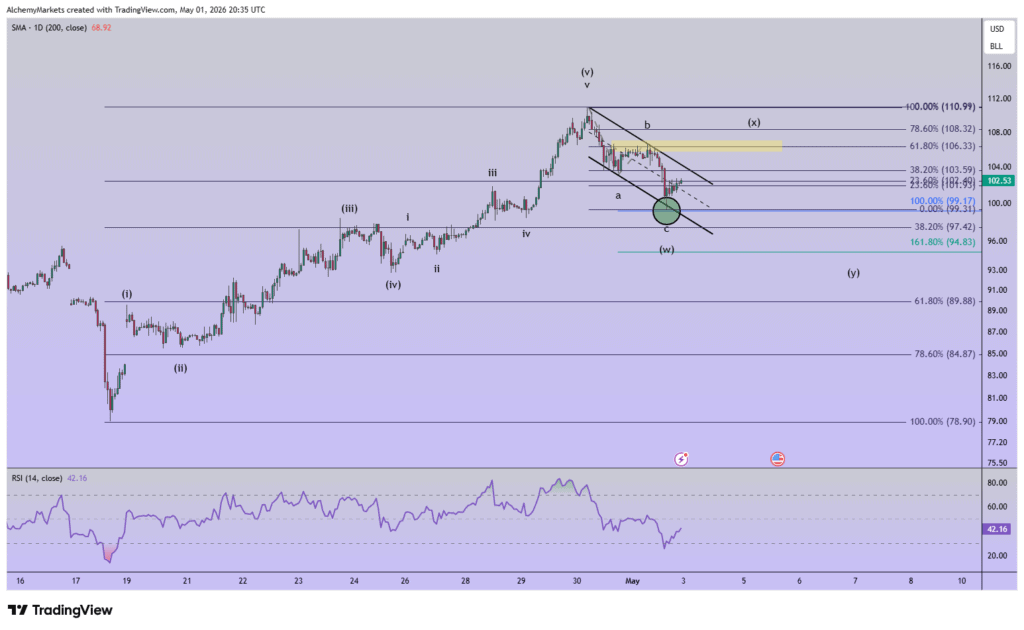
The decline from the $110.93 high to $99.30 low tracks like an Elliott wave zigzag pattern labeled a-b-c. When wave ‘c’ is equal in length to wave ‘a’, this is called an equal wave pattern.
Equal wave patterns are corrective and typically imply a complete retracement at some point in the future. This doesn’t mean prices retrace immediately to the origin of the ‘a’ wave, but that the probabilities are shifting for a new high above $111 in the coming weeks.
The big question is, will the next rally in crude oil take it up to $111?
I suspect the next rally might be a false rally followed by a decline to slightly lower levels. In this scenario, prices may rally to $106 where the 61.8% Fibonacci retracement sits. Notice that the price zone is also guarded by previous resistance.
It’ll be tough for crude oil to punch above $106. As a result, I’m leaning towards the next rally counting as wave (x) of a larger (w)-(x)-(y) decline. Once this double zigzag completes, then it may kick off the rally to new highs above $111.
Bottom Line
Crude oil carved an equal wave decline. This sets up a potential rally to $106. Eventually, prices likely trend to $111, but that may be after another decline.


