Skriven av:


- Chart of the Day
- augusti 4, 2026
- 3 min läsning
JPY Pairs May Bounce. Can the S&P 500 Hold Its Breakout?
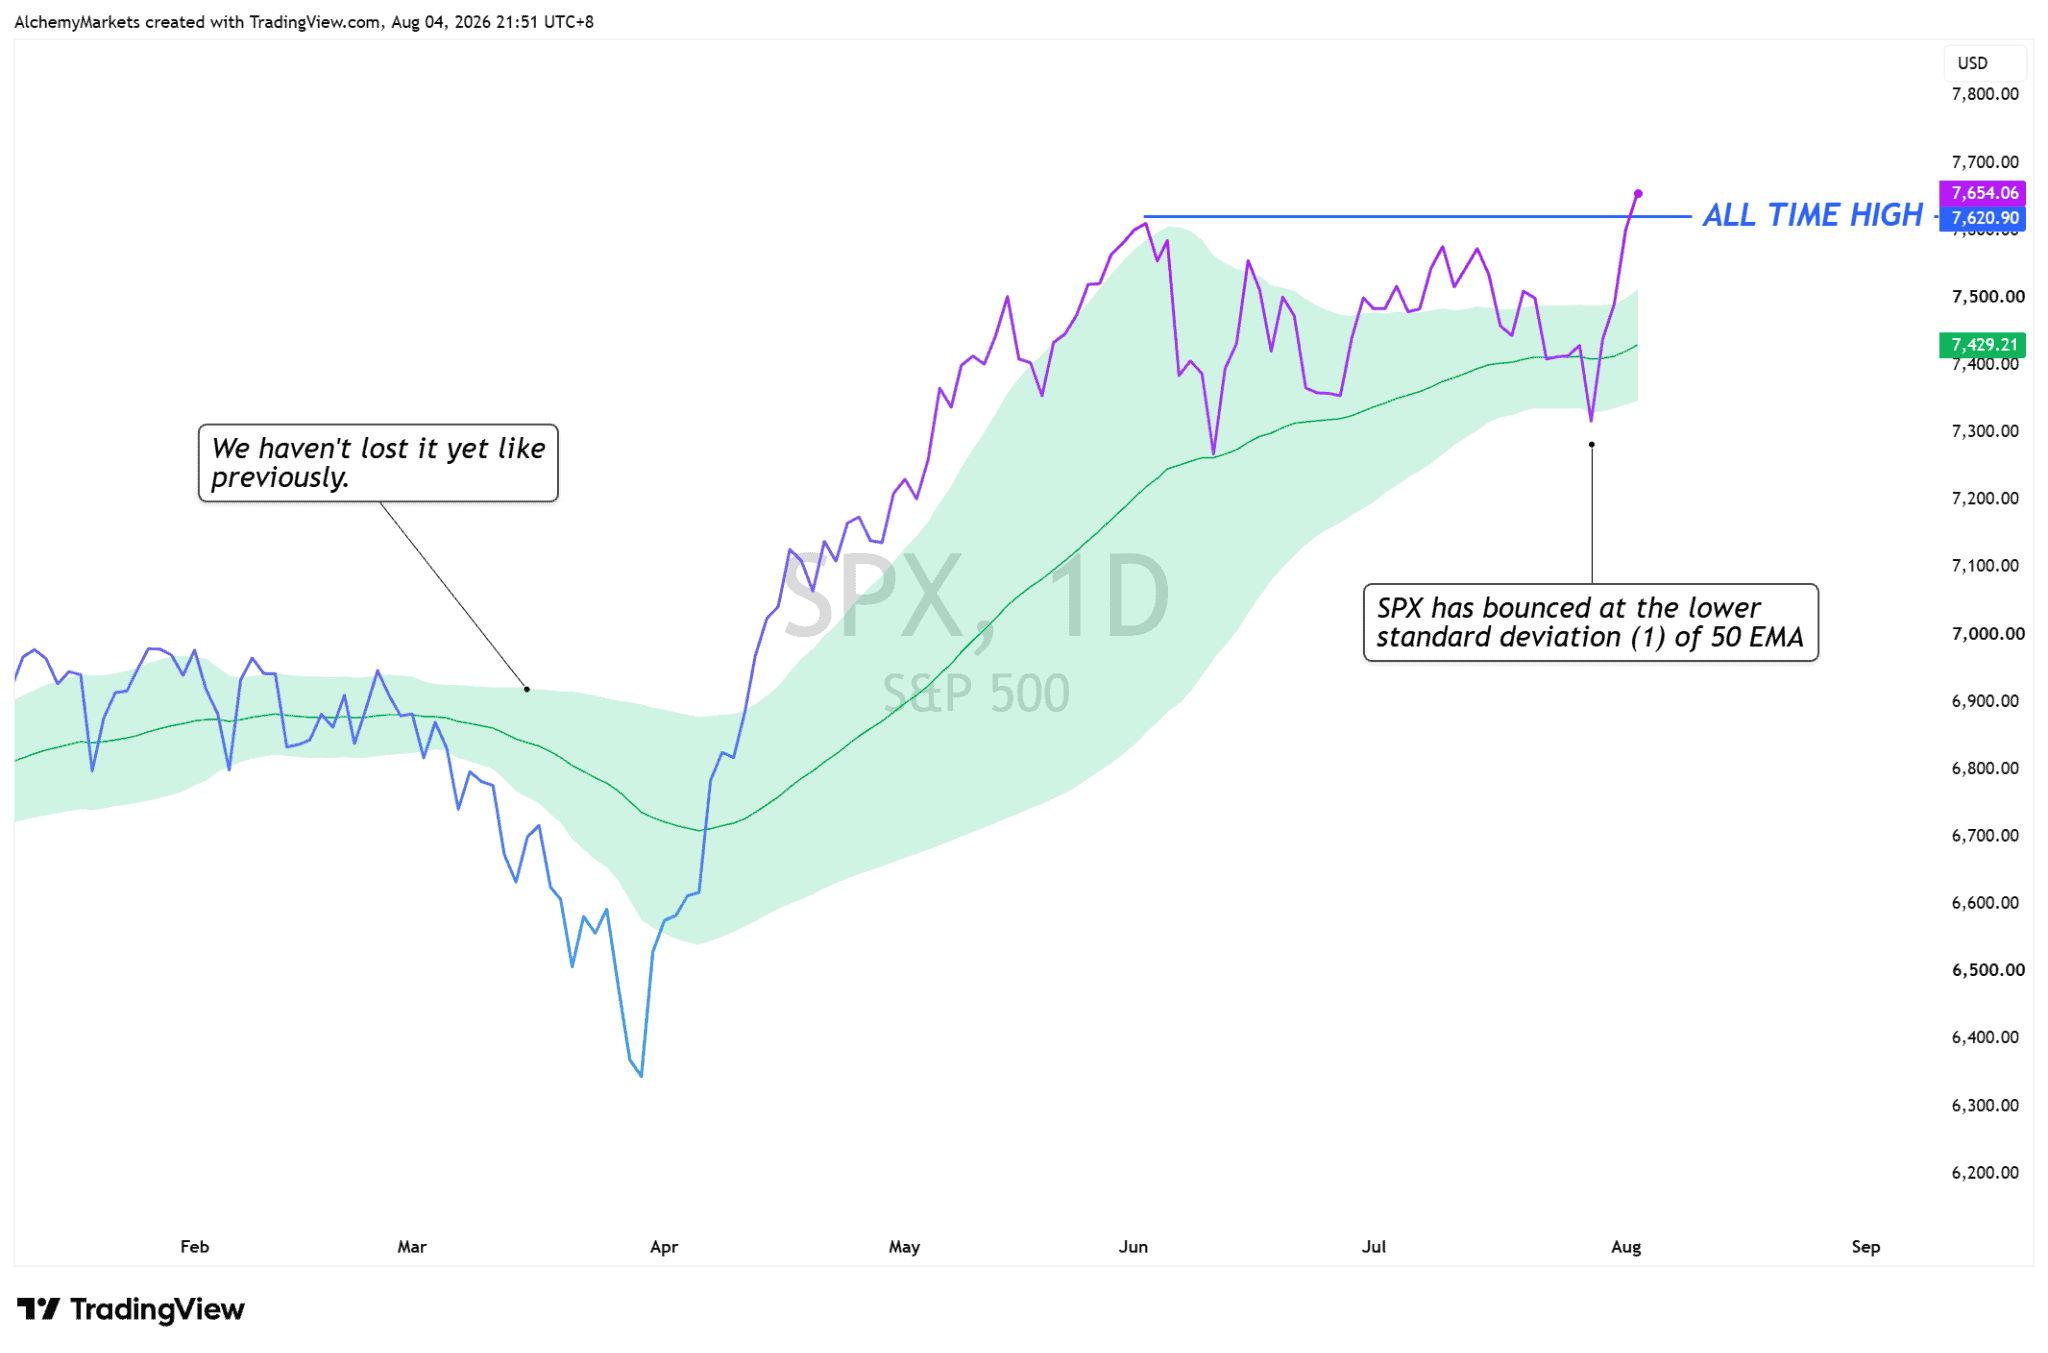
Japan’s stock market was hit after a rare, coordinated US-Japan yen intervention strengthened the yen. The Nikkei fell sharply from its June high, while the S&P 500 remained close to record levels and has now briefly pushed to a fresh high.
The latest charts point to a support test rather than a confirmed global unwind. USDJPY, AUDJPY and GBPJPY are all testing their daily 200 EMA bands, while the Nikkei is holding around its previous low and daily 100 EMA band.
Why Japan sold off while US stocks held up
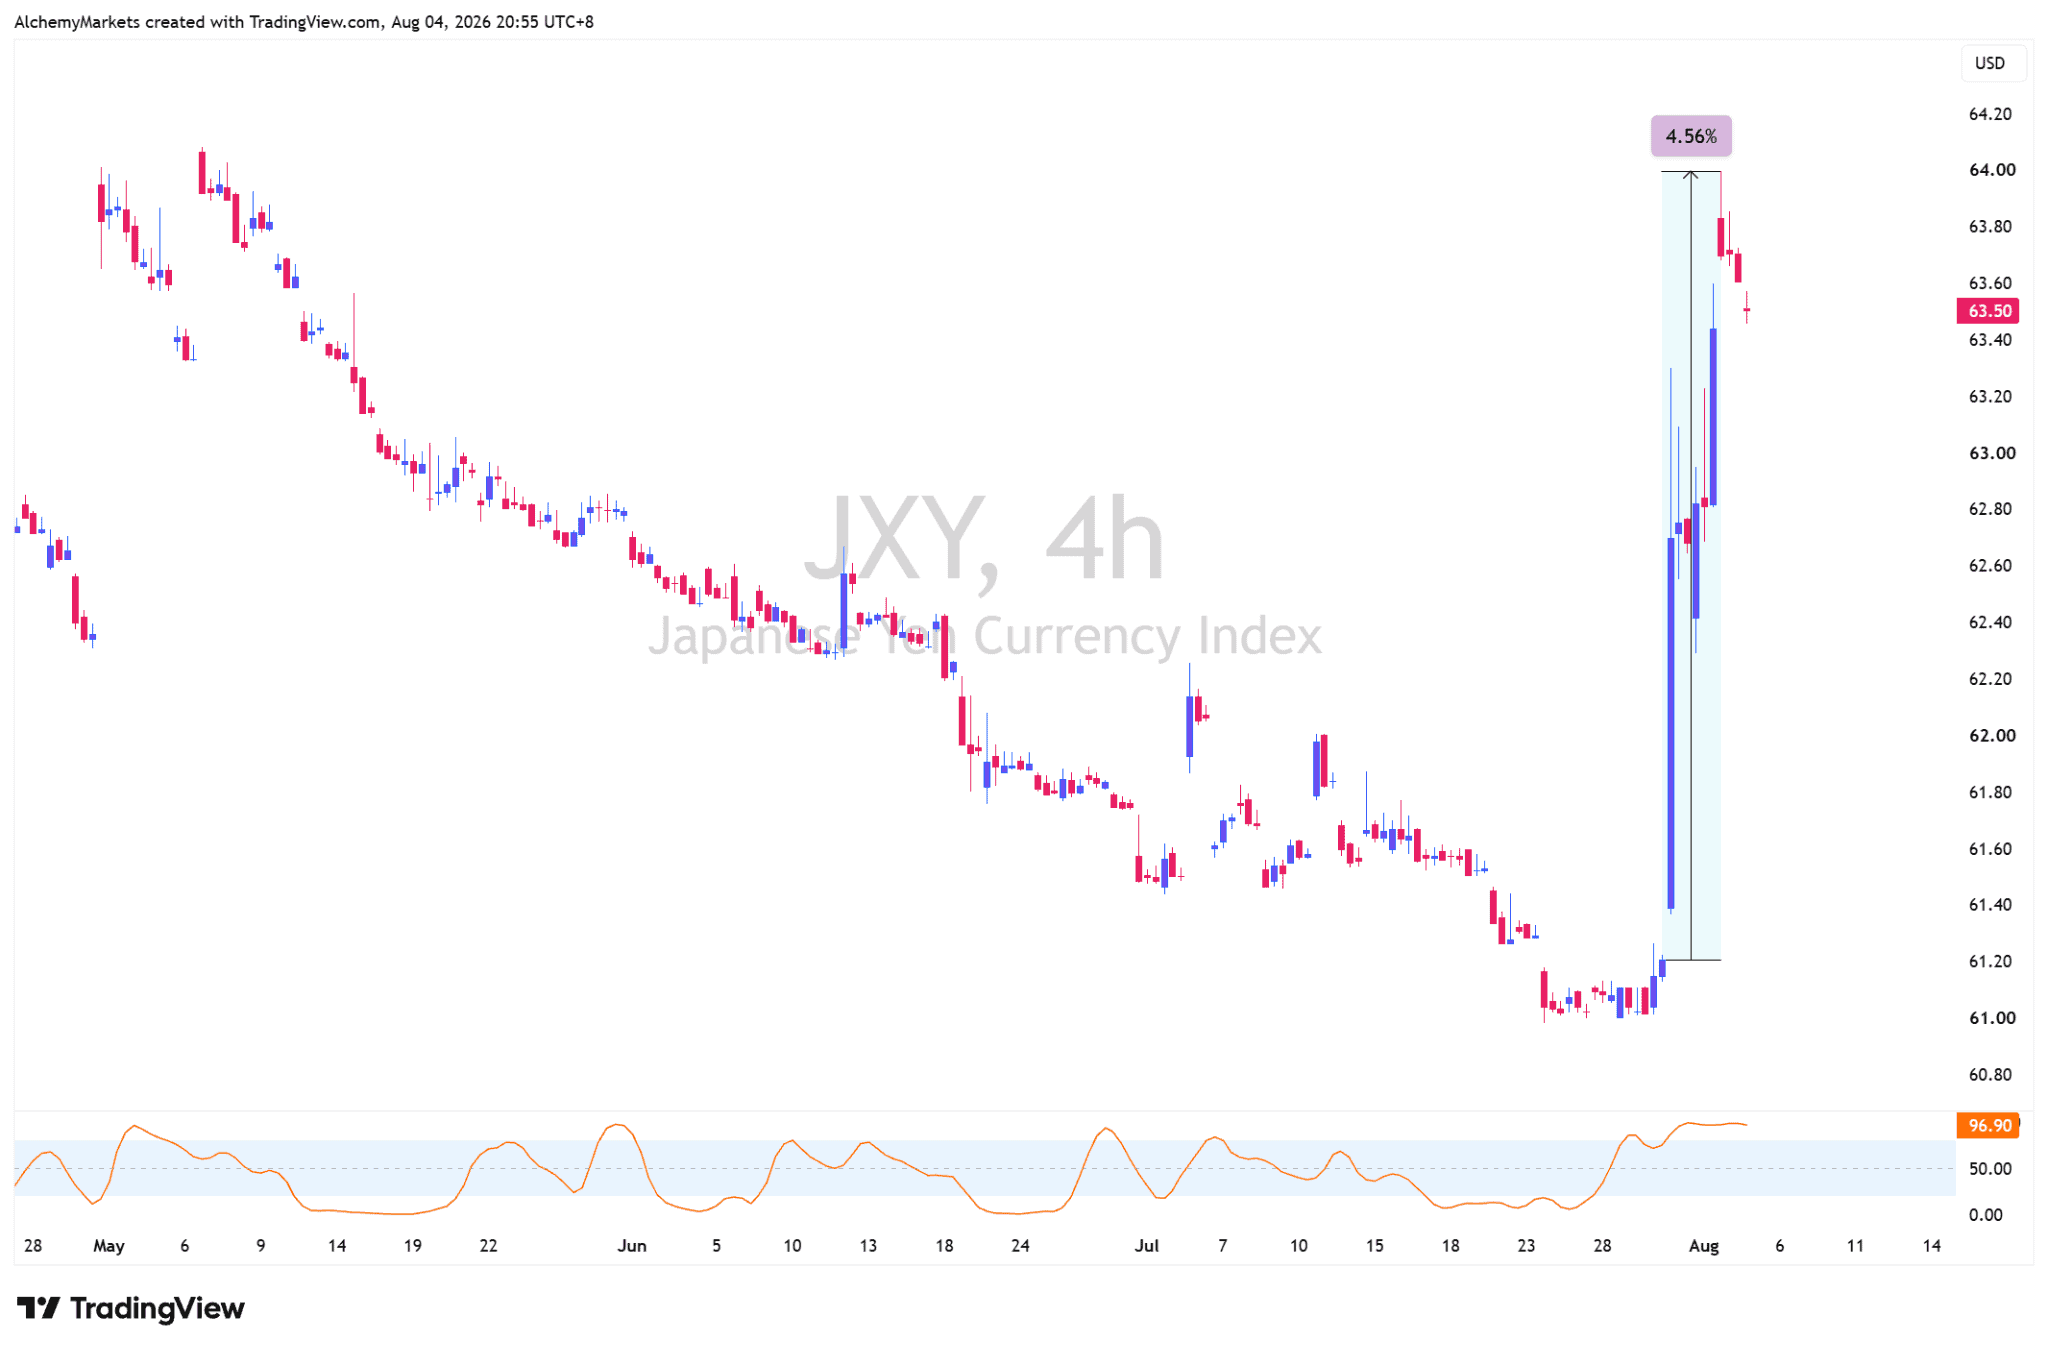
Following the intervention, the yen strengthened by roughly 4.5% from Thursday’s low. That created an immediate headwind for Japanese exporters because overseas earnings become less valuable when converted back into yen.
A stronger yen can also reduce the appeal of yen-funded carry trades. However, the S&P 500 has so far treated the move as a Japan-specific shock, helped by a softer US dollar and continued demand for US equities.
USDJPY is sitting on the main decision zone
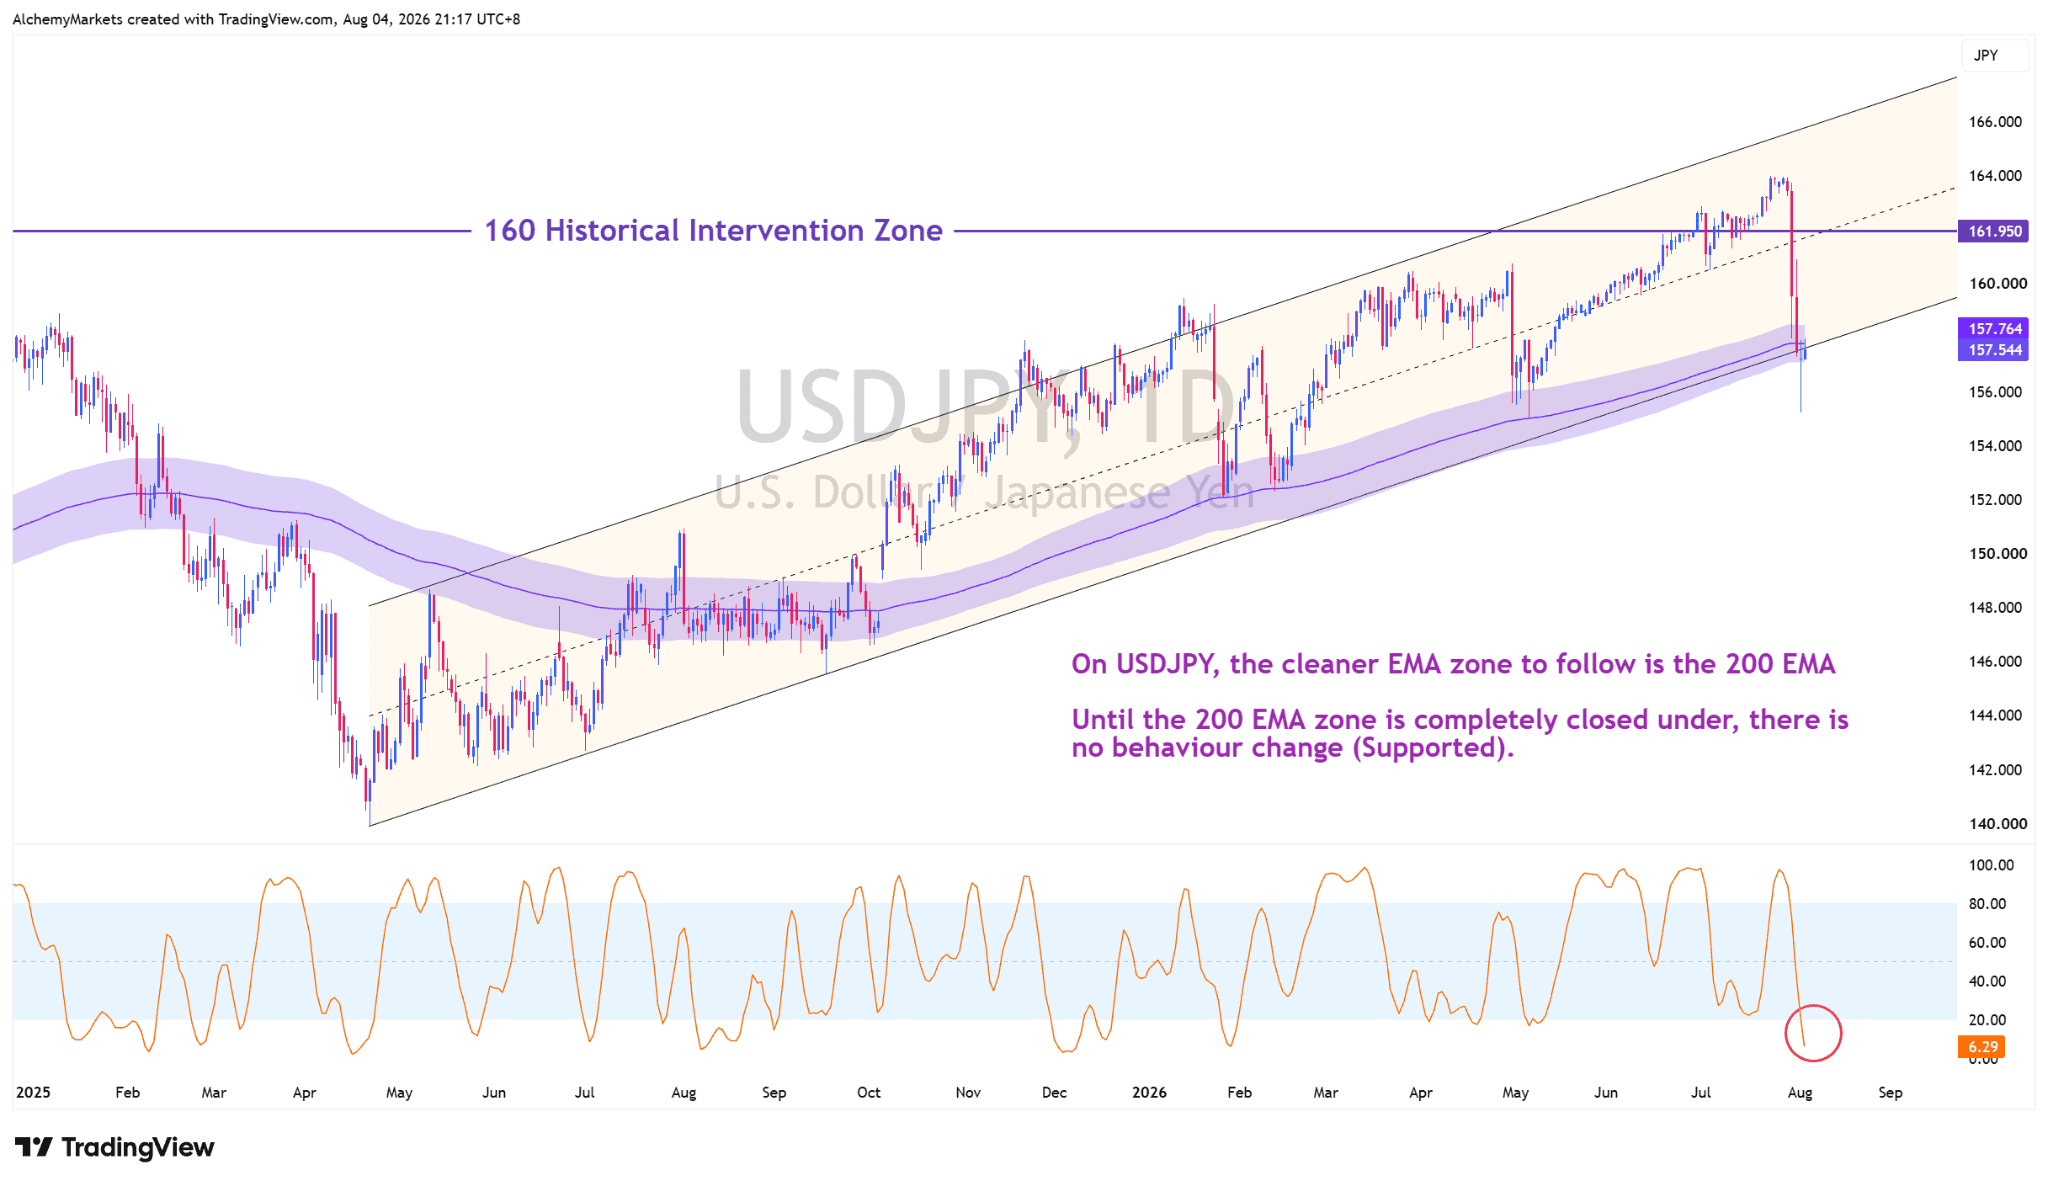
USDJPY is testing the daily 200 EMA band, which also sits close to the lower edge of its rising channel.
Daily stochastic RSI is also flashing oversold, so a pause or rebound from this area would be normal.
A daily close beneath the band would matter more. It would combine a loss of dynamic support with a channel break, raising the risk that the move has shifted from intervention shock to a broader trend change.
AUDJPY and GBPJPY Are Also Flashing Bounce Signals
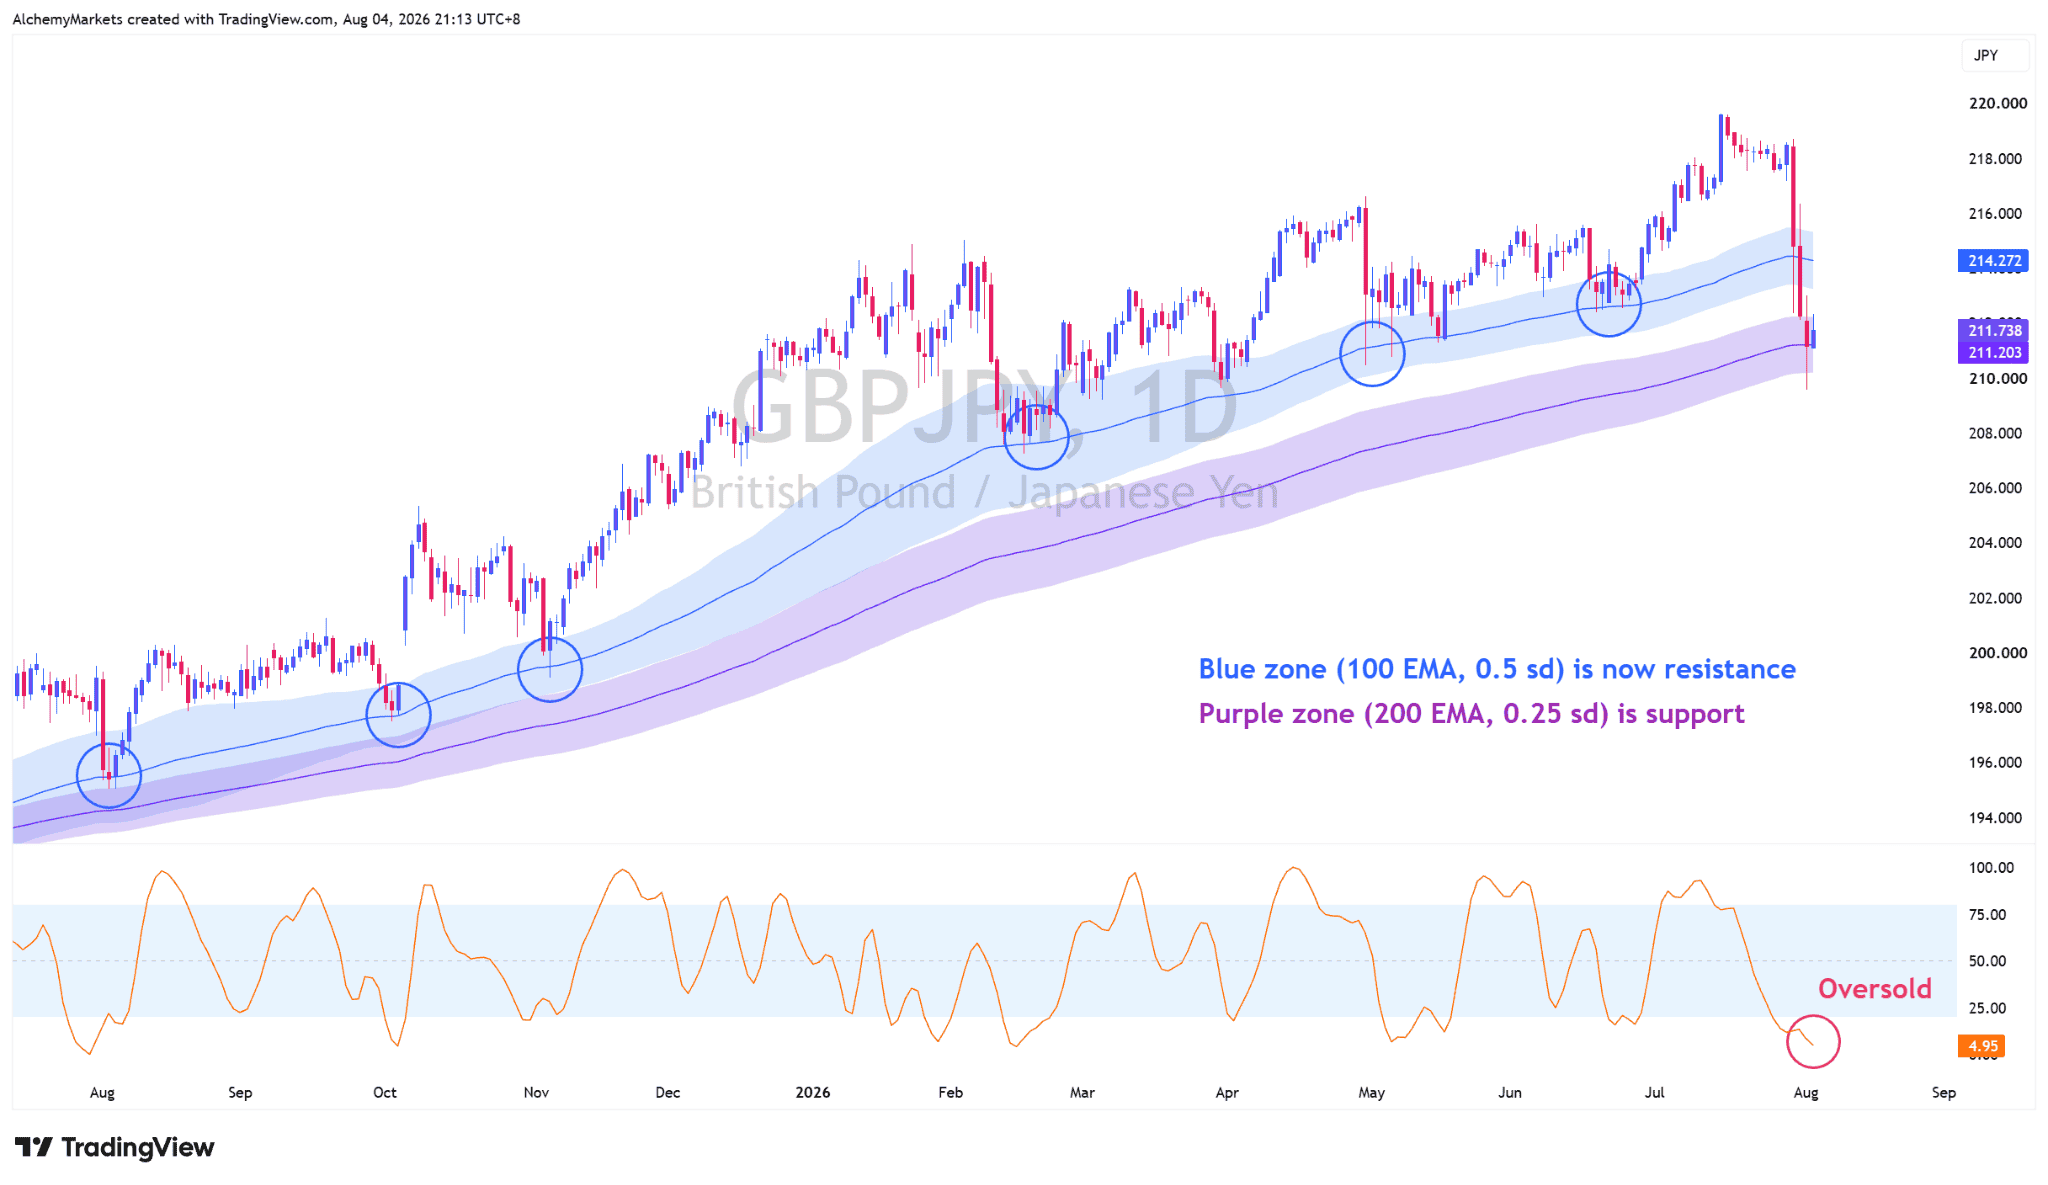
Just like the USDJPY, the AUDJPY and Dragon pair are both sitting at their 200 EMA supports with oversold signals.
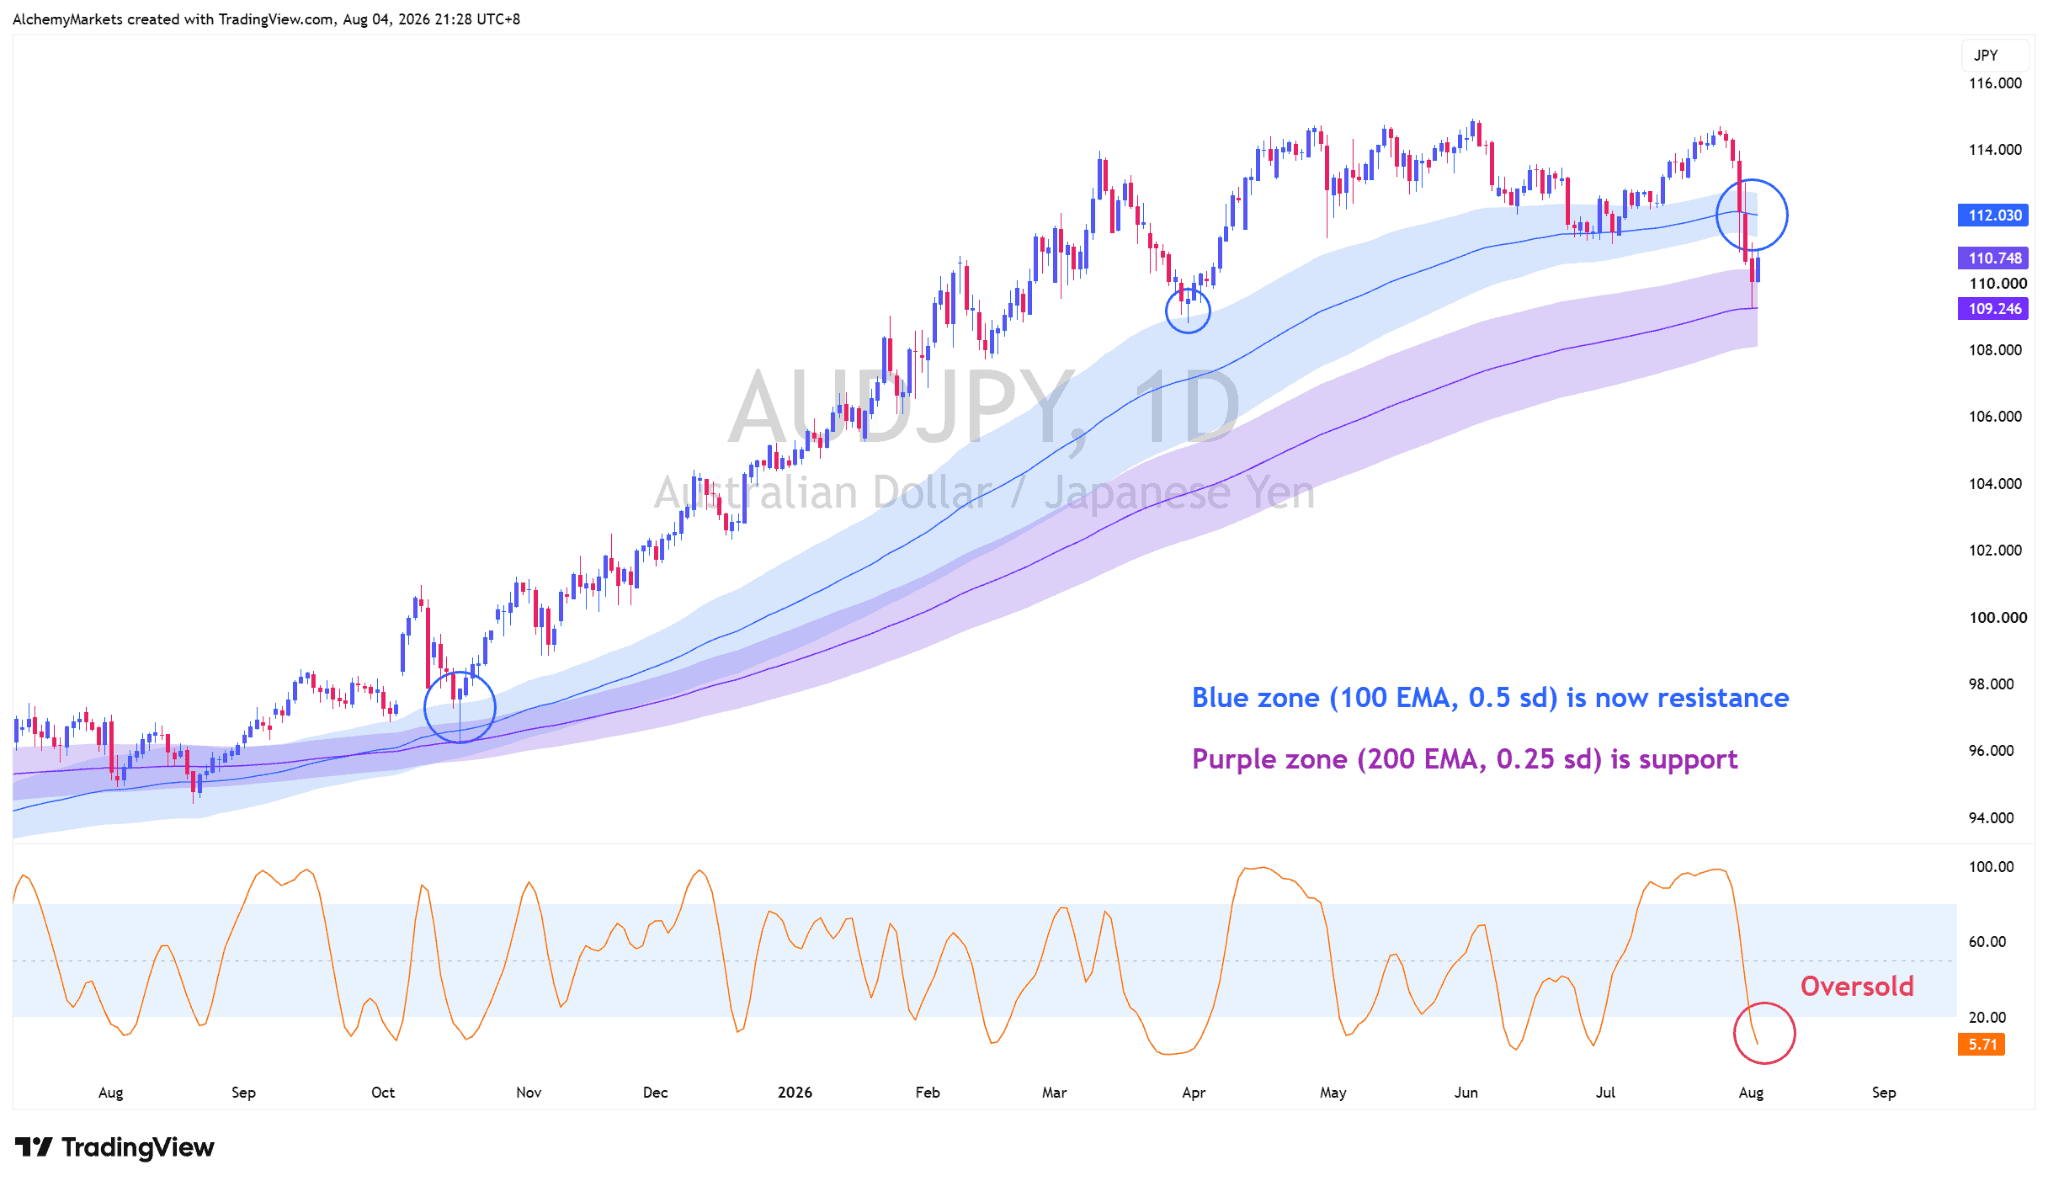
AUDJPY, the risk on sentiment proxy, is the useful risk gauge because both sides of the pair can weaken during a sell-off. It is testing the daily 200 EMA band and remains oversold.
Previously, the 100 EMA daily band appears to have been a strong area of support for AUDJPY, so a revisit of the EMA could see the pair reject off what was once support (at ~112 now).
Likewise, the dragon pair, GBPJPY’s rebound may face resistance near the former 100 EMA support around 214.3.
The daily 200 EMA band is still holding for now which suggests some JPY softening for now.
The Nikkei has reached support, but the bounce is incomplete
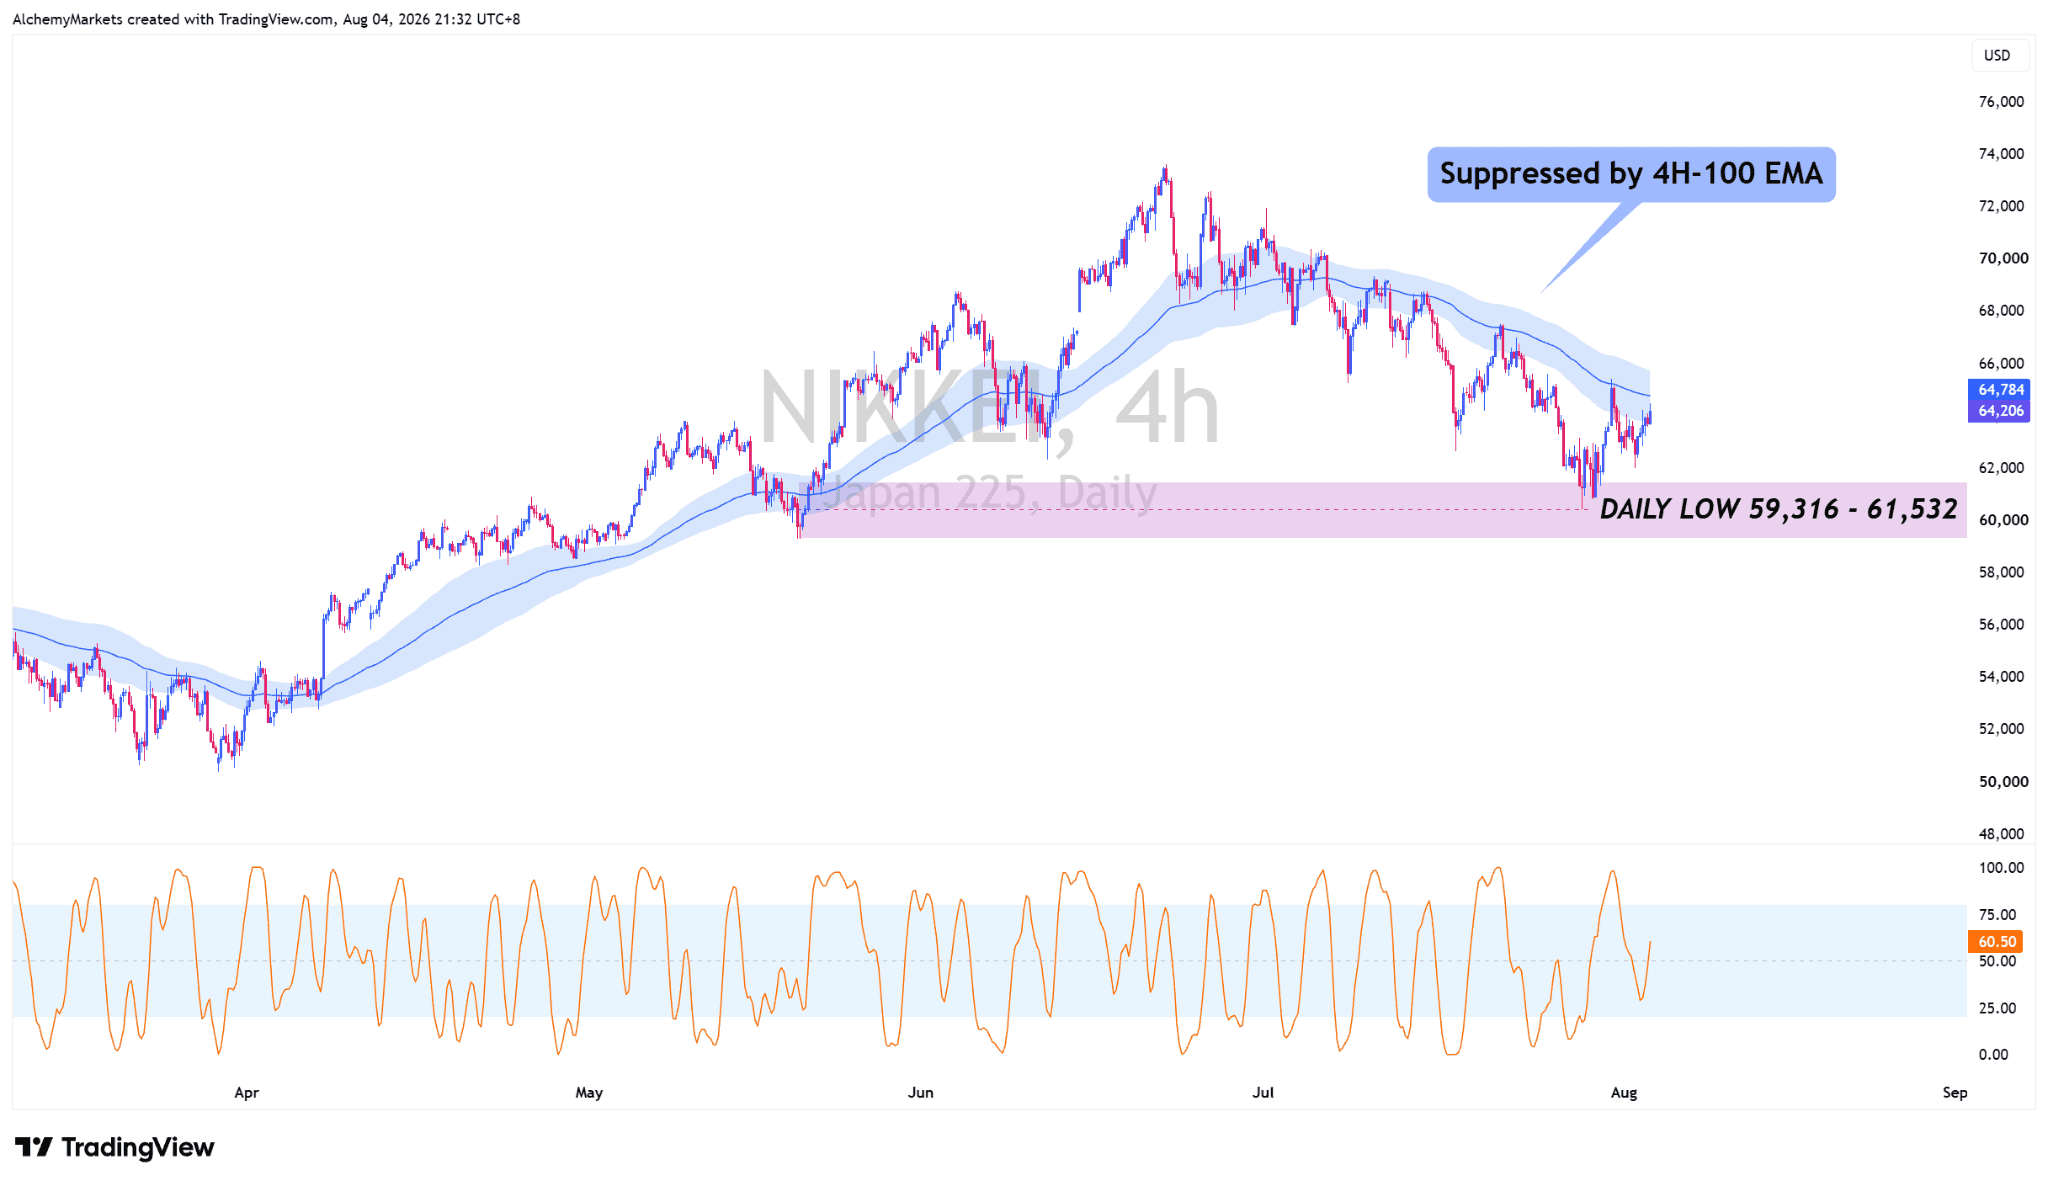
The Nikkei fell as much as roughly 18% from its June high before recovering from the 59,316-61,532 area.
However, a stronger sign of a “cooling Yen strength” should be observed on the four-hour chart, where the Nikkei remains below the 100 EMA band.
A break above that band, followed by a successful retest, would be the first stronger sign that Japanese equities are stabilising.
What happens next?
The current setup supports the possibility of a bounce of JPY pairs.
A coordinated rebound in USDJPY, AUDJPY and GBPJPY would suggest that markets have absorbed the initial intervention shock. That could help the Nikkei recover while allowing the S&P 500 to hold above its previous record.
The risk would increase again if the yen crosses close beneath their 200 EMA bands while the Nikkei loses its recent low.
Until that happens, the wider carry unwind remains a risk rather than a confirmed market shift.