


Skriven av:


- Chart of the Day
- september 14, 2026
- 2 min läsning
USD/JPY Bear Flag Points Towards 151.70
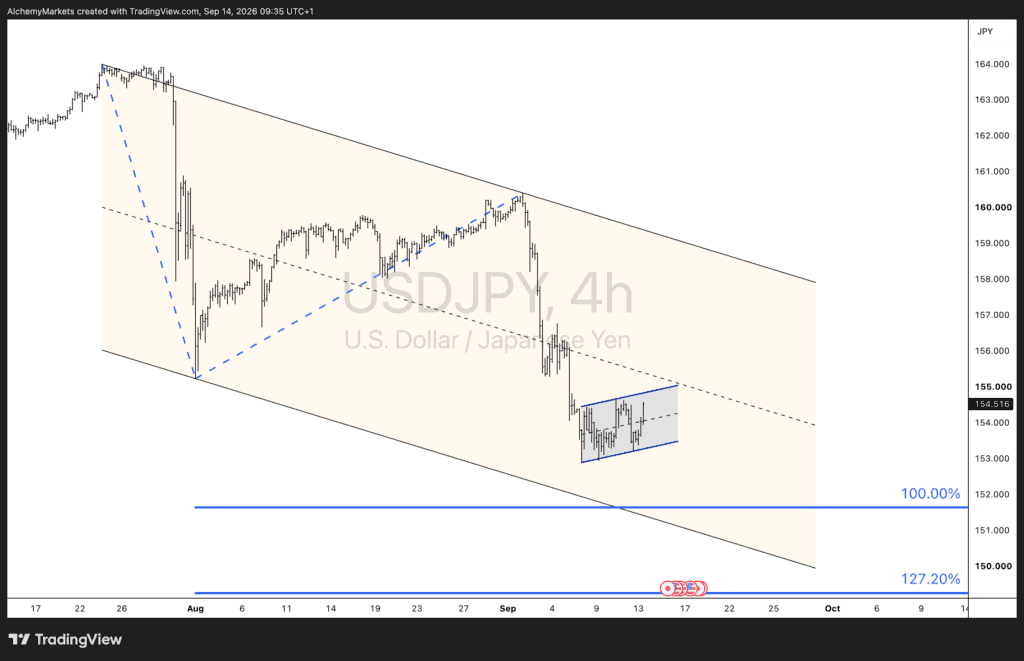
USD/JPY remains technically heavy on the four-hour chart, with price continuing to trade inside the broader descending channel that has controlled the pair since the late-July high near 164.00.
The latest move lower has taken USD/JPY from around 160.00 towards the 153.00–154.00 region. Since then, price has started consolidating inside a small upward-sloping channel. Given that this consolidation follows a sharp bearish impulse, the structure resembles a bear flag rather than the beginning of a meaningful reversal.
The key area to watch is the lower boundary of the flag around 153.30–153.50. A clean break below this area would signal that sellers are regaining control and could open the door for another leg lower.
The technical target comes from projecting the previous bearish leg from the flag structure. The 100% Fibonacci extension sits around 151.70, making this the first major downside objective. Importantly, that level also sits close to the lower boundary of the broader descending channel, creating additional technical confluence.
For now, therefore, the bias remains bearish while USD/JPY stays contained beneath the flag resistance and the broader falling channel. A break below the flag would strengthen the case for 151.70, while a sustained move above roughly 155.00–155.30 would weaken the immediate bearish setup and suggest the consolidation may have further to run.
Key level: 153.30–153.50 bear-flag support
Bearish target: 151.70 – 100% Fibonacci extension
Invalidation area: sustained break above 155.00–155.30
ChatGPT can make mistakes. Check important info.






