


Scritto da:


- Weekly Outlook
- Aprile 3, 2026
- 6 min di lettura
A Strong Jobs Report… But Not the Full Picture
This week’s Non-Farm Payrolls (NFP) report came in stronger than expected, and at first glance, it looked like a clear signal that the U.S. economy is holding up well.
The headline number showed +178,000 jobs added, comfortably beating expectations. On top of that, the unemployment rate ticked down to 4.3%, which again looks like a positive sign.
If you stopped there, you’d probably think: strong economy equals bullish stocks.
But as always with NFP, the detail tells a more nuanced story.
When you dig deeper, the report becomes far more mixed. Wage growth slowed to 0.2% month-on-month, average hours worked declined, and labour force participation dropped. Hiring strength was also concentrated in a few sectors rather than being broad-based.
In other words, companies are still hiring, but they’re doing so cautiously. Wage momentum is cooling, and fewer people are actively participating in the workforce.
So what does this actually mean for markets?
A strong headline NFP reduces the urgency for the Federal Reserve to cut rates. That tends to push bond yields higher, particularly at the front end, and can act as a short-term headwind for equities.
At the same time, the softer internals suggest the labour market is not overheating. Instead, it points to an economy that is holding up for now but showing signs of slowing beneath the surface.
So rather than a clean bullish or bearish signal, what we really have is a “higher for longer” environment in the short term, with underlying cracks beginning to form.
That sets the stage perfectly for next week’s key event.
Next Week’s Focus: CPI Takes Centre Stage
If NFP was about growth, next week is all about inflation.
The main event is U.S. CPI on Friday, and this has the potential to be a major market mover.
March inflation is expected to rise meaningfully, driven primarily by a sharp increase in gasoline prices. Gasoline has a weighting of more than 3% in the CPI basket, and when combined with related costs such as distribution, lubricants, and airfares, the impact becomes significant.
On a non-seasonally adjusted basis, gasoline prices have moved from around $3 per gallon at the start of March to above $4 in early April, with the potential to push toward $4.50 in the coming weeks.
As a result, month-on-month CPI could come in as high as 1%, pushing the year-on-year rate up to around 3.4% from 2.4%.
Core inflation is expected to be more stable, but still relatively firm at around 0.3% to 0.4% month-on-month.
So how should we think about this?
In simple terms, headline inflation may rise sharply, but that doesn’t necessarily signal a strong economy. Instead, this type of inflation—driven by energy—can be demand-destructive.
Higher fuel costs reduce household disposable income, leaving consumers with less to spend elsewhere. That, in turn, can slow broader economic activity over time.
This creates a difficult balance for the Federal Reserve. On one hand, rising inflation reduces the likelihood of near-term rate cuts. On the other, a cooling labour market and squeezed consumers argue against further tightening.
The result is a macro environment that looks increasingly like “stagflation-lite”—where inflation is elevated but growth is slowing.
Technical Analysis: S&P 500 at a Key Decision Point
S&P 500 (Market Cap Weighted)
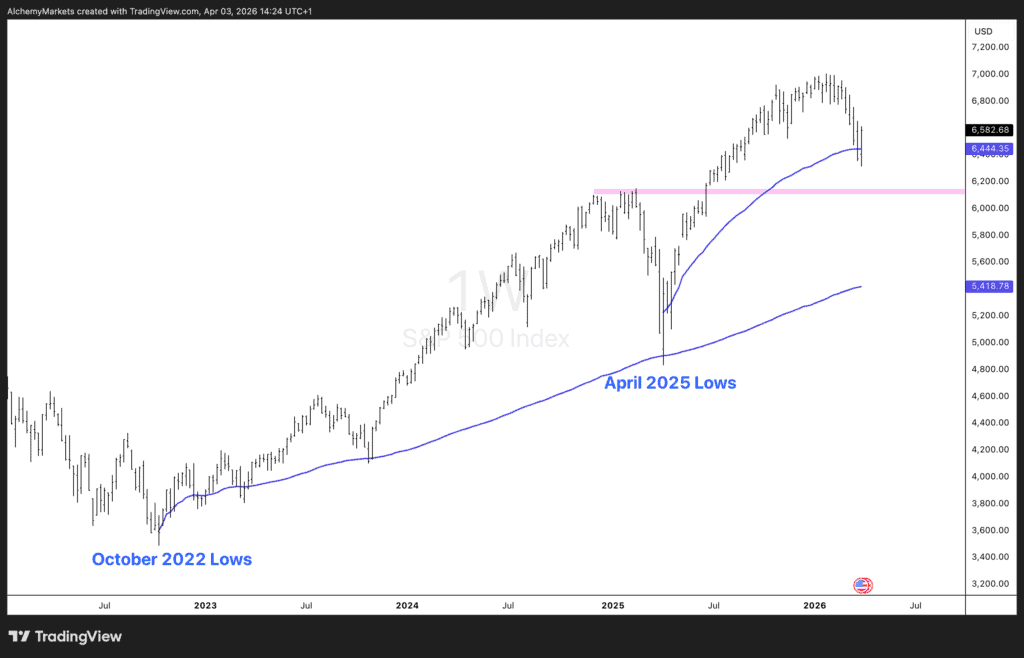
The S&P 500 has been in a strong uptrend since the October 2022 lows, but we’re now starting to see signs of potential weakness.
Price is currently pulling back from recent highs and testing key support levels, making this an important area to watch.
The key level on the downside is the 6100 support zone. This is a critical horizontal level that, if broken, could open the door to further downside.
Alongside this, the anchored VWAP from the April 2025 lows is acting as near-term dynamic support. If price breaks below 6100 and fails to hold this VWAP, it would suggest a shift in momentum.
In that scenario, the next major area of interest becomes the anchored VWAP from the October 2022 lows. This would act as the next key dynamic support level and represent a deeper pullback within the broader uptrend.
So in simple terms, holding current levels keeps the bullish structure intact, but losing them would likely lead to a more meaningful correction.
Equal-Weighted S&P 500
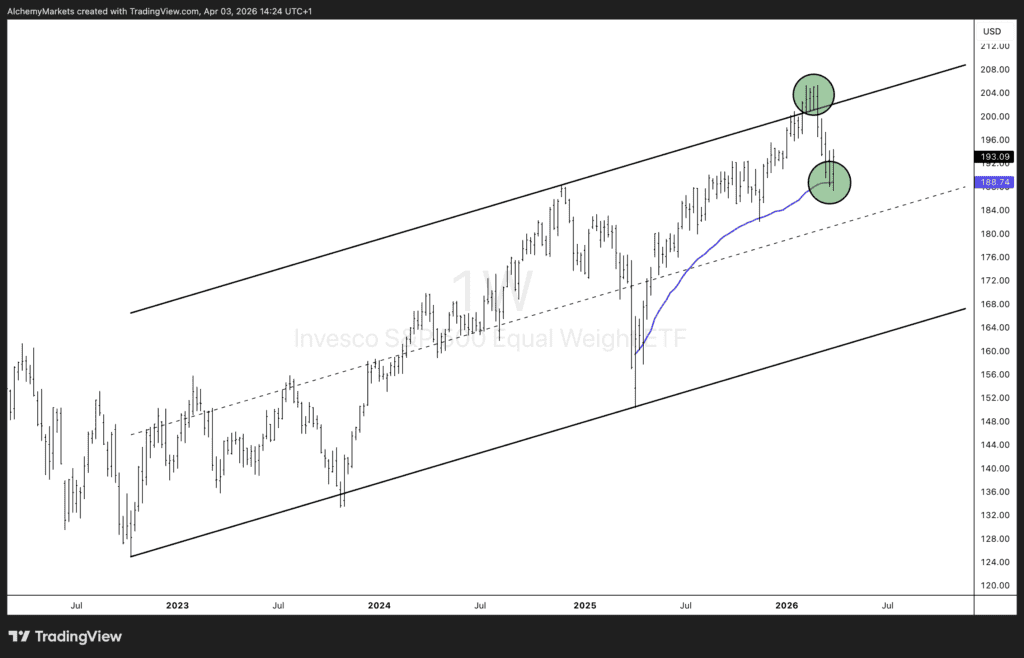
Looking at the equal-weighted index provides additional context, particularly around market breadth.
Unlike the standard S&P 500, which is heavily influenced by large-cap stocks, the equal-weighted version reflects the performance of the broader market.
Right now, it’s in a very interesting position.
Price is trading near the upper boundary of a long-term ascending channel that has been in place since the 2022 lows. At the same time, it is sitting on the anchored VWAP from the April 2025 lows.
In other words, it is effectively sandwiched between resistance above and support below.
While price is currently respecting this VWAP, the positioning suggests that this is a fragile equilibrium.
We would not be surprised to see price reclaim that VWAP from below, particularly if macro conditions deteriorate or if inflation data comes in stronger than expected.
This reinforces the idea that, despite the strength in the headline index, the broader market is not as strong as it appears.
Final Thoughts
This week’s NFP report showed resilience in the labour market, but the details point to a more fragile underlying picture.
Next week’s CPI release now becomes the key driver, with rising energy prices likely to push inflation higher and complicate the outlook for the Federal Reserve.
At the same time, the S&P 500 is sitting at a critical technical level, with both the standard index and the equal-weighted version showing signs of potential inflection.
Taken together, this suggests that markets are entering a period where macro and technical factors are closely aligned.
The key question for the week ahead is whether inflation forces a repricing of “higher for longer,” or whether growth concerns begin to dominate.
Either way, the setup points to a market that is approaching a decision point rather than one that is comfortably trending.


