Scritto da:

- Opening Bell
- Novembre 2, 2026
- 5 min di lettura
Stocks Always Rose After Midterms. What Could Break the Streak?
Nineteen US midterm elections since 1950. Nineteen positive S&P 500 returns over the following year, according to Capital Group’s historical study. On paper, that sounds like one of the easiest bullish trades in the market.
Except the S&P 500 is testing its 100-day support, semiconductors have fallen towards their 200-day support, and oil is swinging on both peace talks and threats of further fighting around Iran.
Tomorrow’s vote might remove one uncertainty, but it cannot repair every balance sheet or reopen a shipping route.
First, the number everyone wants to believe
The bold claim is that the S&P 500 rose after every US midterm election since 1950. That is broadly supported by Capital Group’s historical study: every one of the 19 completed midterm cycles through 2022 delivered a positive price return in the following twelve months, with an average gain of 15.4%.
There is a second number circulating: 13.8%. A Schaeffer’s study published in 2022 found an average 13.89% over six months after midterms, in the 18 elections available at that time.
Does the rally begin immediately, or is there a second-week trap?
The twelve-month statistic obscures a less dependable opening.
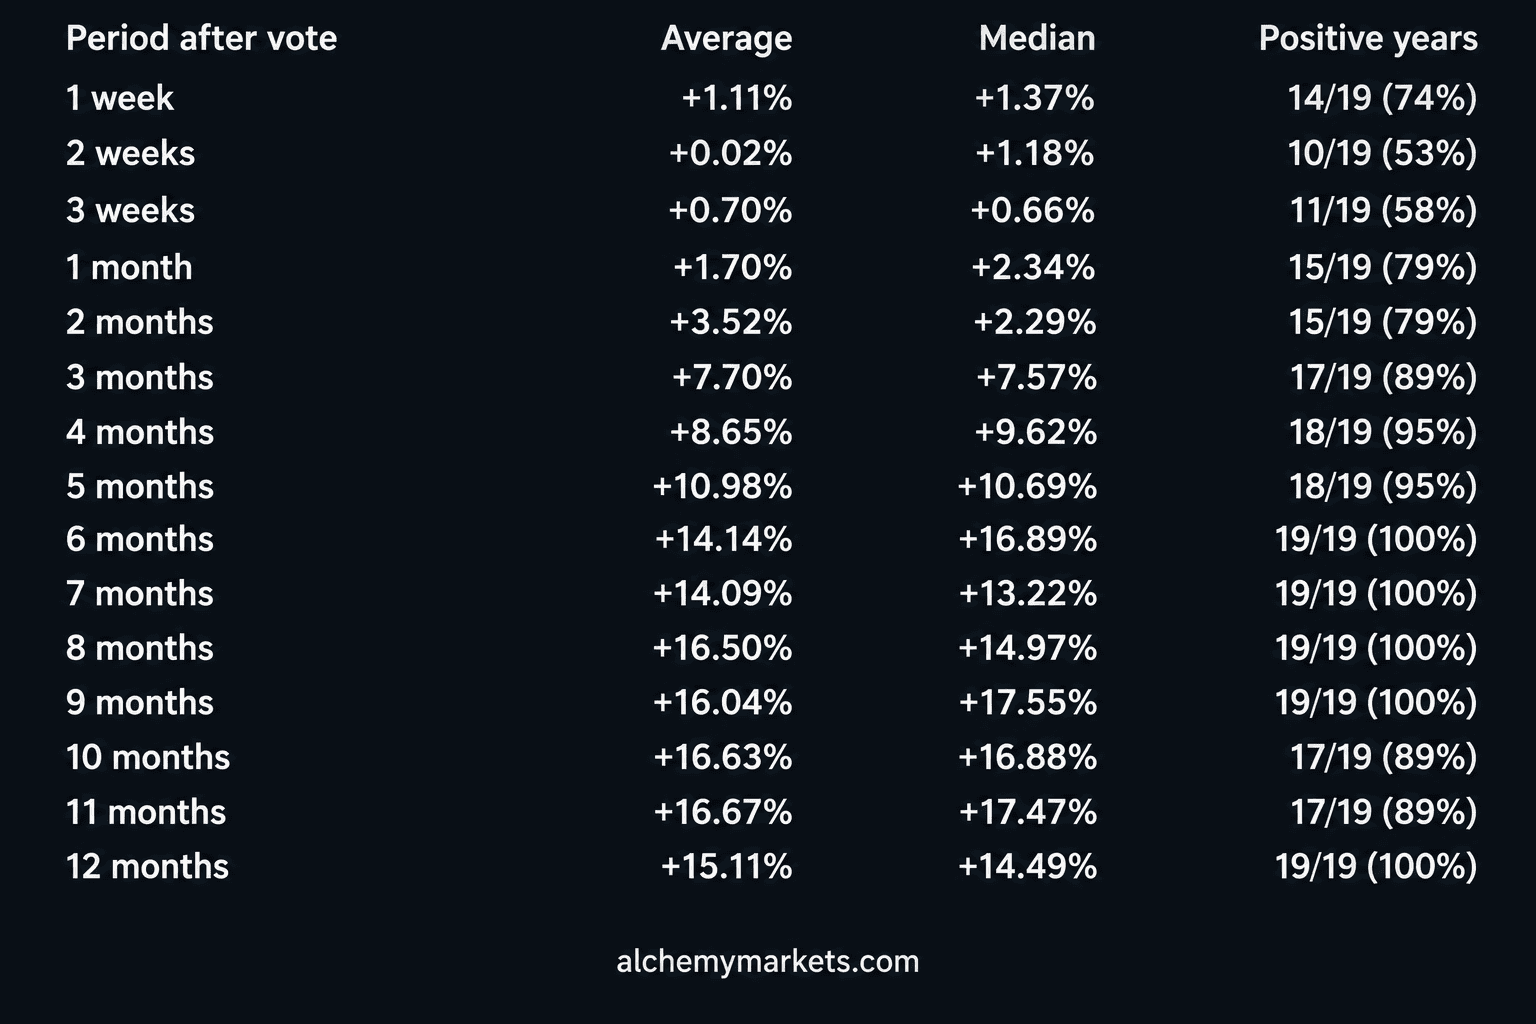
The S&P 500 was higher a week after 14 of the 19 elections since 1950, but by week two only 10 of 19 were positive. After one month the win rate improved to 15 of 19. A strong first-week relief move was not a guarantee that gains held.
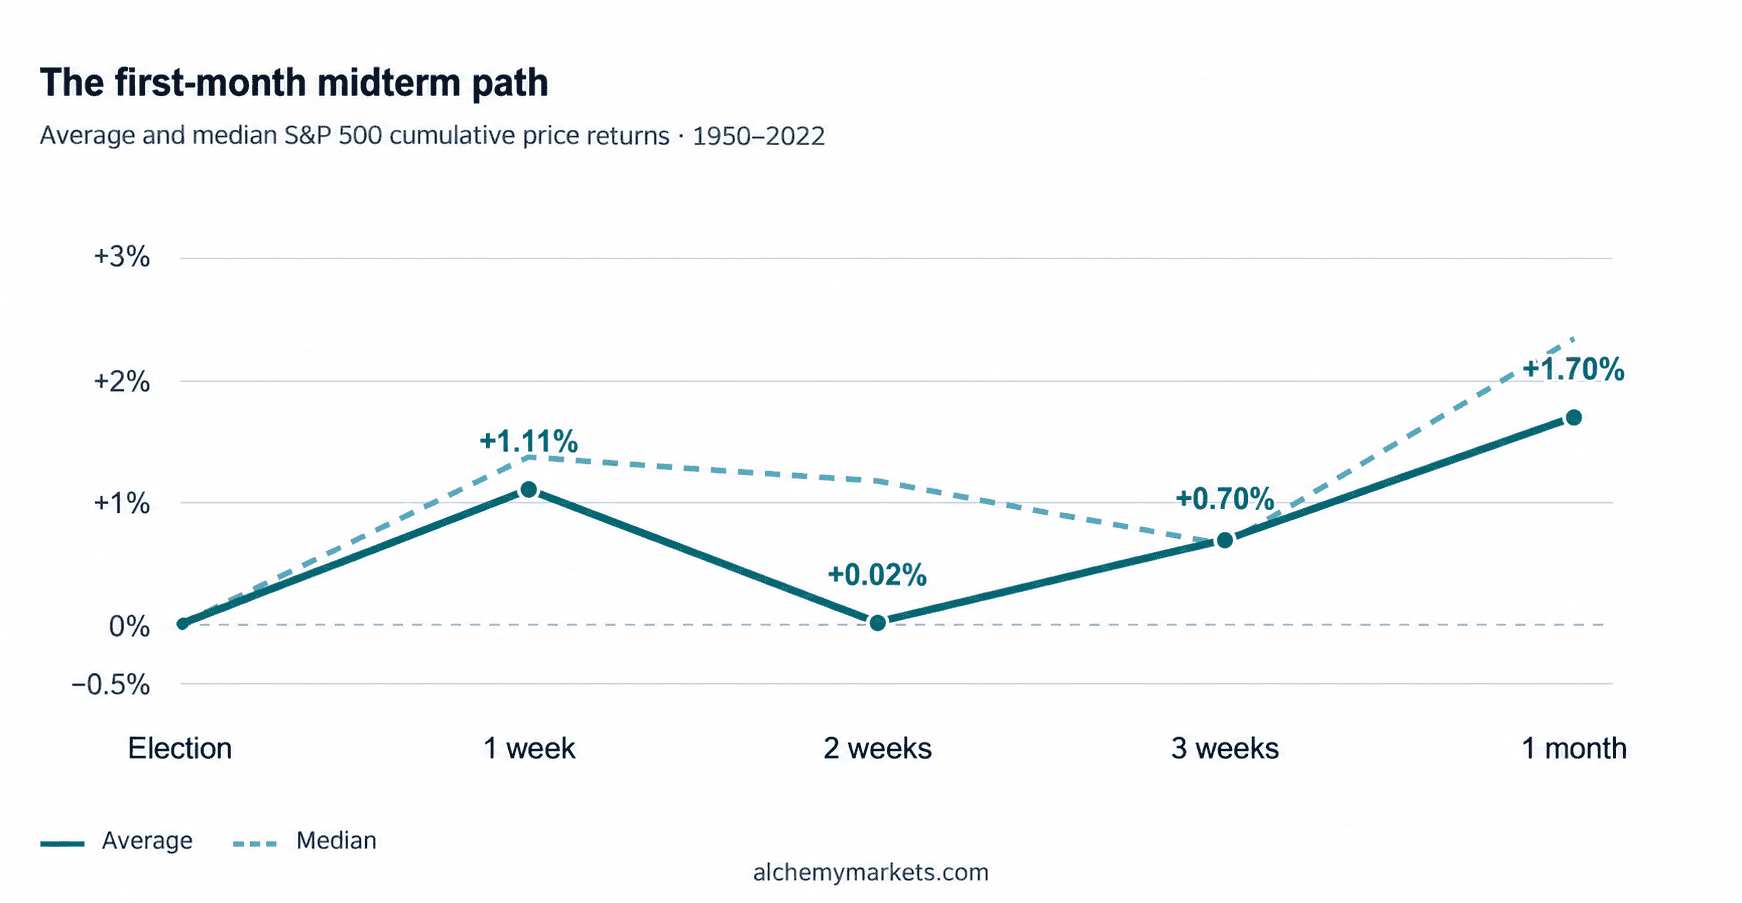
The second week has usually resulted in a retracement, but what follows 79% of the time in a month is an average rise of +2.34%.
The first-to-twelve-month record reads as such:
First test: does the S&P 500 hold its trend?
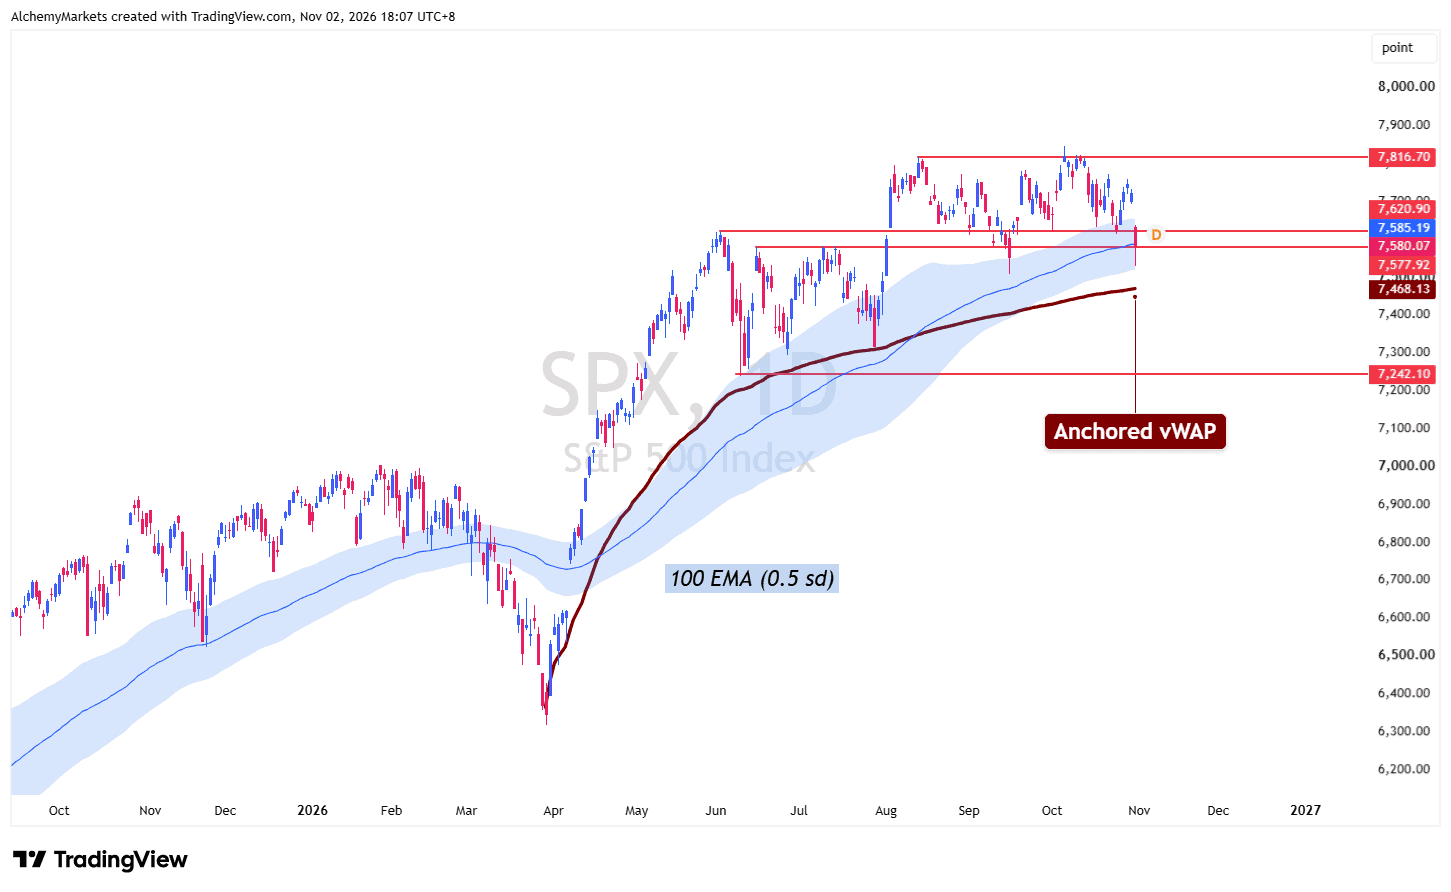
On the 2 November daily SPX chart, price is testing the 100-day EMA bollinger band® (0.5 standard deviation).
The important downside reference is 7,468, near the anchored VWAP. On the upside, 7,620 is the level I want to see reclaimed, ideally on a weekly close, before treating a rebound as more than short covering.
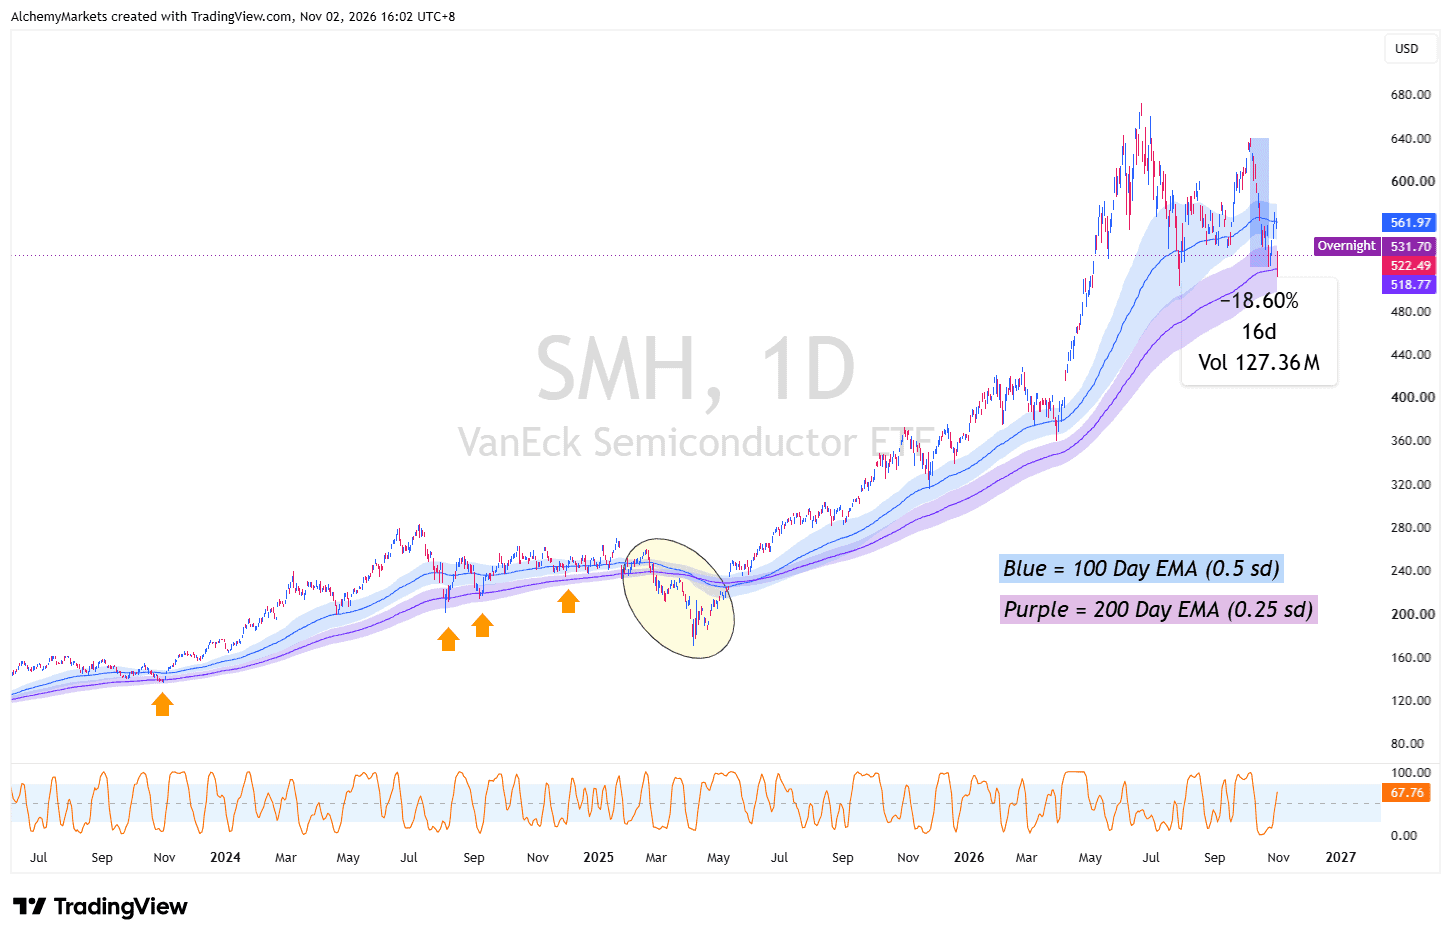
Semiconductors show a similar dilemma. SMH has returned to the purple 200-day EMA (0.25sd) zone near 518.77, an area it has respected on earlier pullbacks.
But the recent blue 100-day EMA band is still overhead, around 561.97. A bounce into that zone followed by rejection would be a warning that buyers have not regained control.
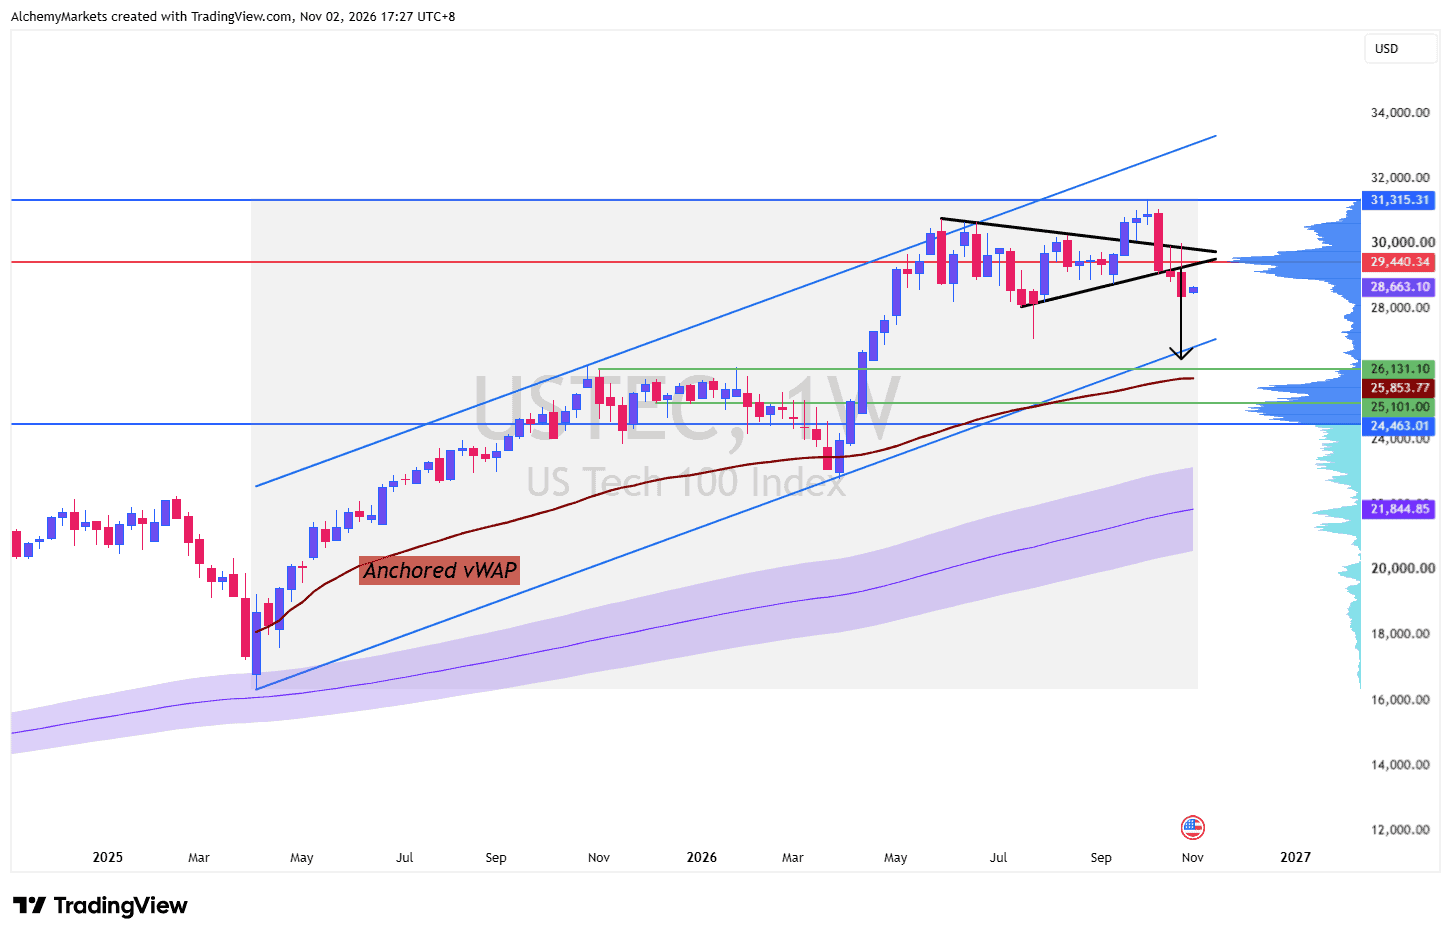
The Nasdaq chart also shows a breakdown from a symmetrical triangle pattern within its broader rising channel.
The working downside target is the low of the channel, but a more concrete volume-backed support to watch would be 25,853–26,131.
The price is currently sitting at a thin volume-profile area, which could allow faster travel downwards if we begin to cascade lower without dip buyers.
Tech and Capex: Good growth, Expensive promises
Strong AI demand is still real. South Korea’s official October export release showed semiconductor exports worth $56.44 billion, up 259.4% from a year earlier.
The headline came just 0.5 percentage points above the pre-release export-growth consensus, however, and the figures mix price, volume and calendar effects. They tell us chips are being sold, not whether every AI investment will earn an attractive return.
Amazon’s third-quarter numbers show the trade-off. AWS revenue reached about $46 billion, up 39.3%, while Amazon’s consolidated trailing free cash flow was negative $42.4 billion. The question for investors is whether rapid cloud growth can eventually earn back the extraordinary cash being invested in infrastructure.
Today’s Apple and Palantir results, followed by AMD on Tuesday after the US close, will test the tech market resilience even further. A company can report excellent revenue and still disappoint if guidance, spending or cash conversion falls short.
For the wider bounce, I would also check whether equal-weight stocks and financials are joining tech rather than relying on a few mega-caps.
The good news is that for now, market breadth is sitting healthy at >60.23% for S&P constituents over the 20-day average and >59.44% for the 200-day average.
Iran could change the inflation argument overnight
Oil is pulling back as mediators circulate proposals to end the US–Iran conflict. Lower crude prices would usually take some pressure off inflation expectations and offer relief to growth shares.
But the Strait of Hormuz has not been confirmed open under a signed deal. UKMTO has recorded fresh vessel warnings, with tankers and ships being struck by projectiles.
There are also rumours floating about renewed US or Israeli strikes after the election – in a major way. If that happens, crude prices will spike as it is a black swan event.
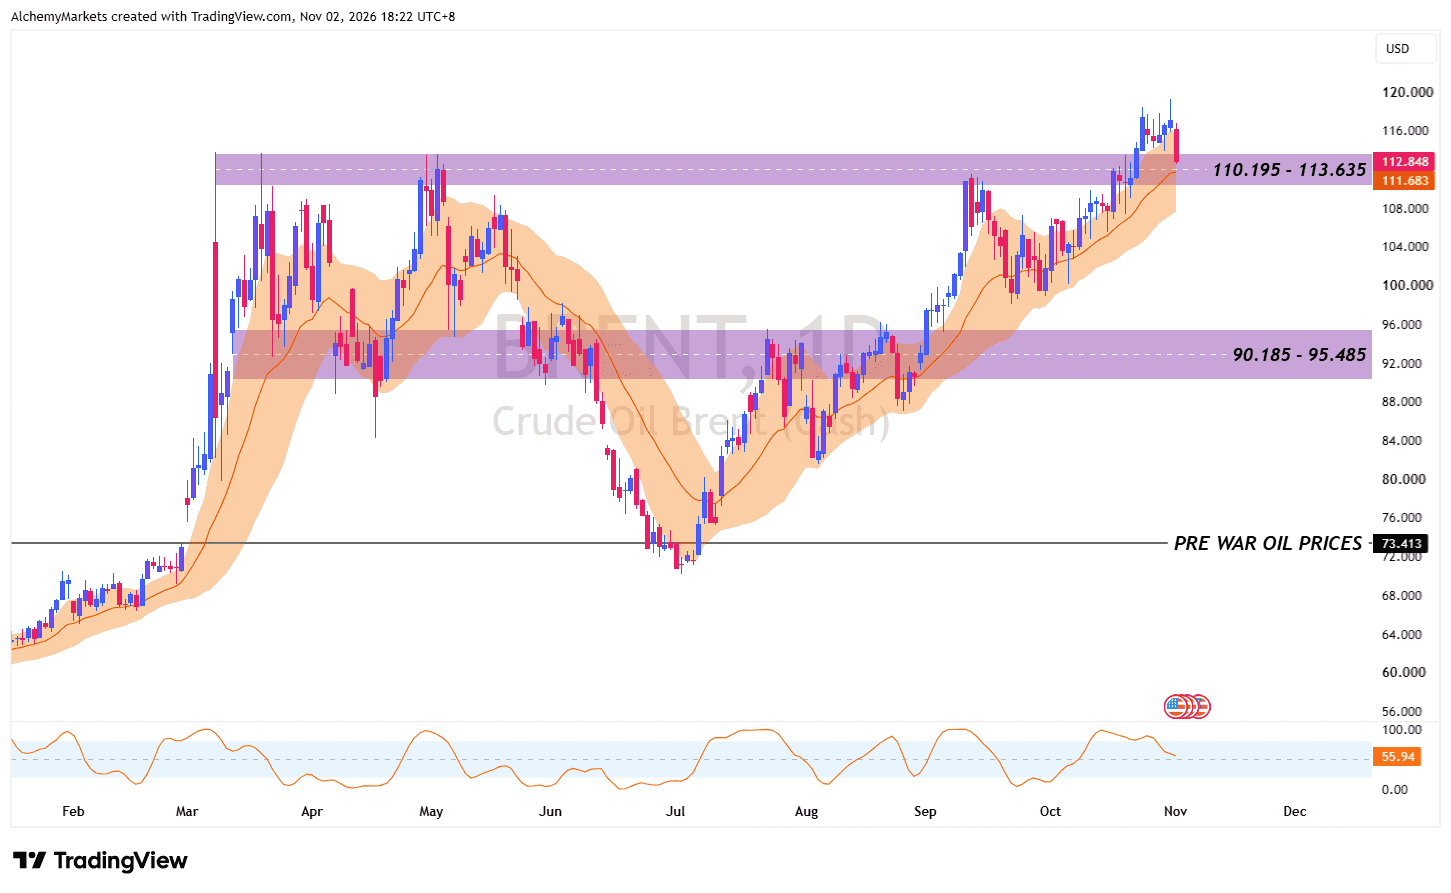
For now, as long as crude remains above its 20-day EMA (1sd), we have to treat retracements as a temporary cool off instead of as longer term deflation.
Goldman Sachs has recently raised their projections for where crude prices will be in December due to disruption risks. Overall, they have Brent at $105/bbl and WTI at $94 by December, which would be supportive of equities.