


- Elliott Wave
- Maggio 14, 2026
- 2 min di lettura
Silver Linings Ahead: Elliott Wave Maps the Next Move
Executive Summary
- Trend Bias: Silver appears to have an incomplete bullish pattern.
- Current Wave Structure: Partial retracement wave 4 OR wave 2 (deeper retracement).
- Key Level: 77.43 – 81.80 potential bullish reversal zone.
Current Elliott Wave Analysis
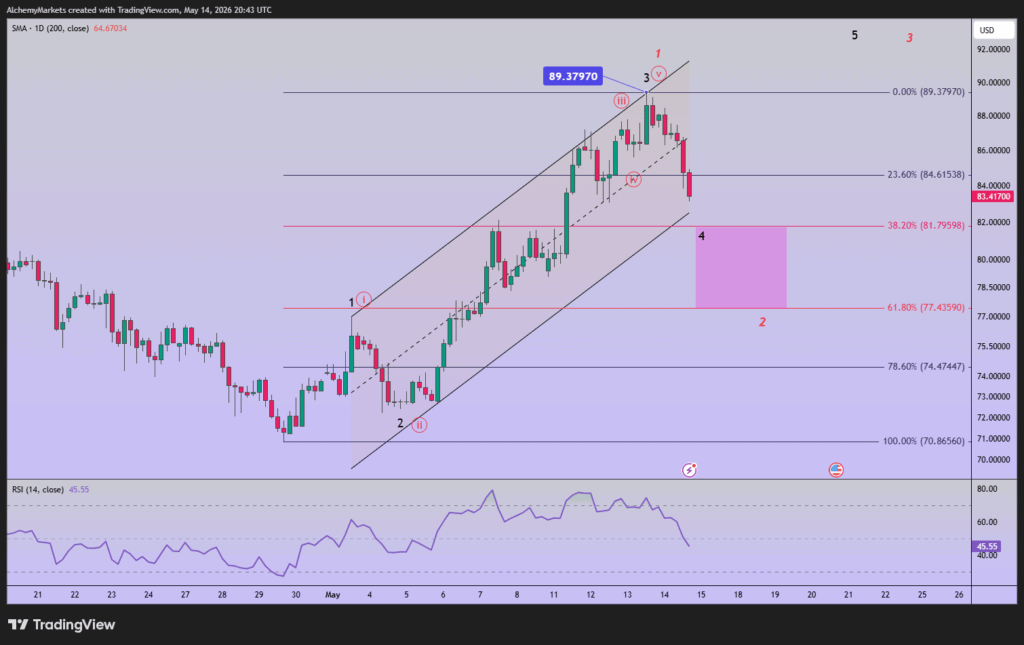
The Elliott wave analysis for Silver (XAG/USD) suggests it is currently in a corrective declining phase. There are two counts I’m following, both follow a similar path with their difference being the depth and time needed to complete the correction.
One wave model suggests the decline from 89.38 is wave 4 of a bullish 5-wave impulse pattern. If so, then a retracement to the 38% Fibonacci level is considered normal. This implies a decline to 81.80.
There is another model we’re following (red labels) that suggests a deeper declining to the 61.8% Fibonacci retracement level near 77.43. This secondarily count would imply the bullish impulse is complete as wave 1 and the decline is a partial retracement wave 2.
Under both scenarios, a decline between 77.43 – 81.80 would be considered ‘normal’. Once this temporary dip completes, both models call for a new high above 89.38.
If silver prices push below the 78.6% Fibonacci level near 74.47, then we’ll consider a different pattern at play.
Bottom Line
Silver’s Elliott Wave structure suggests the current decline may be a temporary correction down to 77.43 – 81.80. Once the dip is complete, then we are forecasting a rally to new highs above 89.38.
If prices push below 74.47, then we’ll consider other wave counts and patterns at play.


