
- Elliott Wave
- Agosto 5, 2025
- 2 min di lettura
Crude Oil Elliott Wave: Sliding Into Support
Executive Summary
- Crude oil has been consolidating the May rally.
- We suspect a bounce rally may develop above $64.03.
- A break below $64.03 opens the door to $58.50.
Current Elliott Wave Analysis
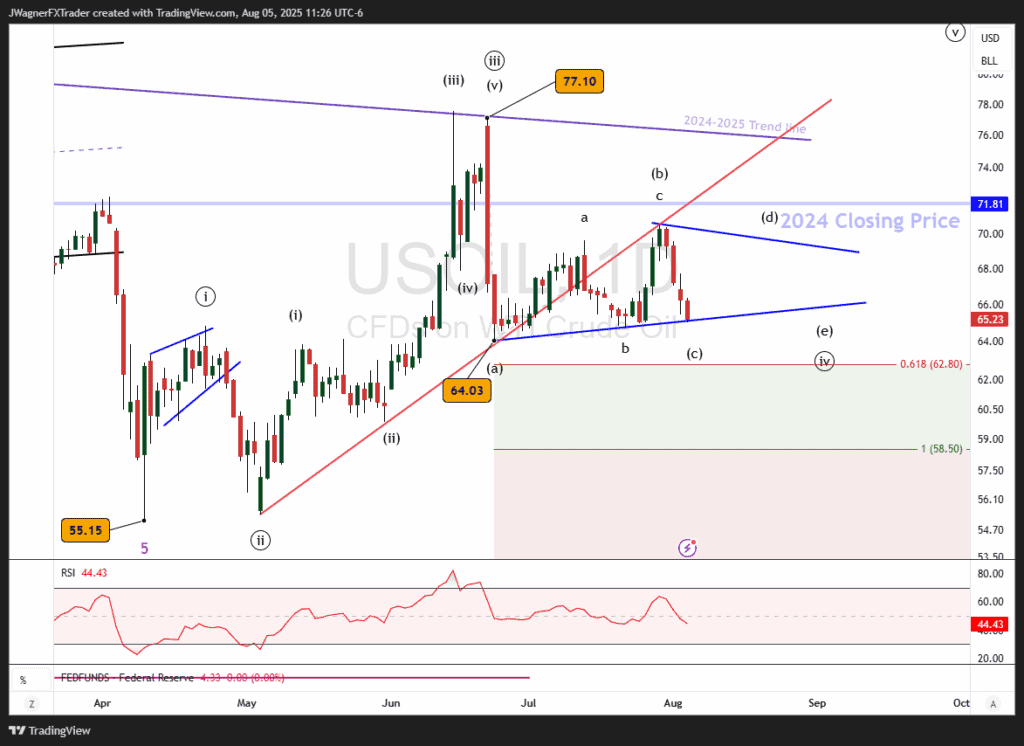
The analysis of Crude oil on the daily chart suggests that we are observing a corrective consolidation pattern. There are several options of patterns that could be developing. I suspect this is a symmetrical triangle where the wave (c) of the triangle is complete or nearly complete. This current decline would need to finalize above the wave (a) low of $64.03.
Under this Elliott wave count, a small rally in wave (d) would develop then another small decline in wave (e).
Once the triangle is completed, then a rally to retest the new all-time high near $77.10 and possibly higher levels.
There is a support trend line floating near the current price that may support and cause prices to bounce higher.
If Crude oil were to fall below $64.03, then we’ll consider a larger bearish zigzag pattern unfolding to $58.50. This price level of $58.50 represents the 100% Fibonacci extension of wave (a).
Bottom Line
Crude oil appears to be nearing the end of wave (c) of ((iv)), a symmetrical triangle. Once the triangle pattern is completed, then a rally is anticipated to retest $77.10.
If $64.03 were broken to the downside, then Crude oil may target $58.50.