Scritto da:

- Chart of the Day
- Agosto 18, 2026
- 9 min di lettura
Nike Is Back at 2014 Prices. More Pain to Come or Opportunity?
Nike has spent the better part of five years proving that a famous brand does not automatically make a value purchase.
If you had been buying up Nike stocks from 2021 to 2026, you would have dramatically lowered the value of your cash. After shares peaked near $179 in 2021, Nike has continuously been in a multiyear downtrend, now extending below the $40 price mark.
A far cry from its former glory.
That leaves the stock roughly 78% below its all-time high and more than $200 billion in market value below its peak.
So what happened? Why did Nike suffer such a long downtrend, and why does the stock now appear to be forming another lower low?
Are bullish investors coping when they now say Nike is a value purchase? Let’s look into it and find out.
Weekly NKE Chart Reveals a Persistent Downtrend from April 2022
On the weekly timeframe, momentum has rolled lower again after a brief two-week bounce. On the monthly chart, the Stochastic RSI is already deeply oversold.
That sounds bullish if you’re looking for macro lows, but peep this… The last few times Nike reached similar conditions, monthly oversold signals have not automatically produced a recovery. In 2022, for example, the stock stayed in a broad weekly downtrend for months after the monthly oscillator had already moved into oversold territory.
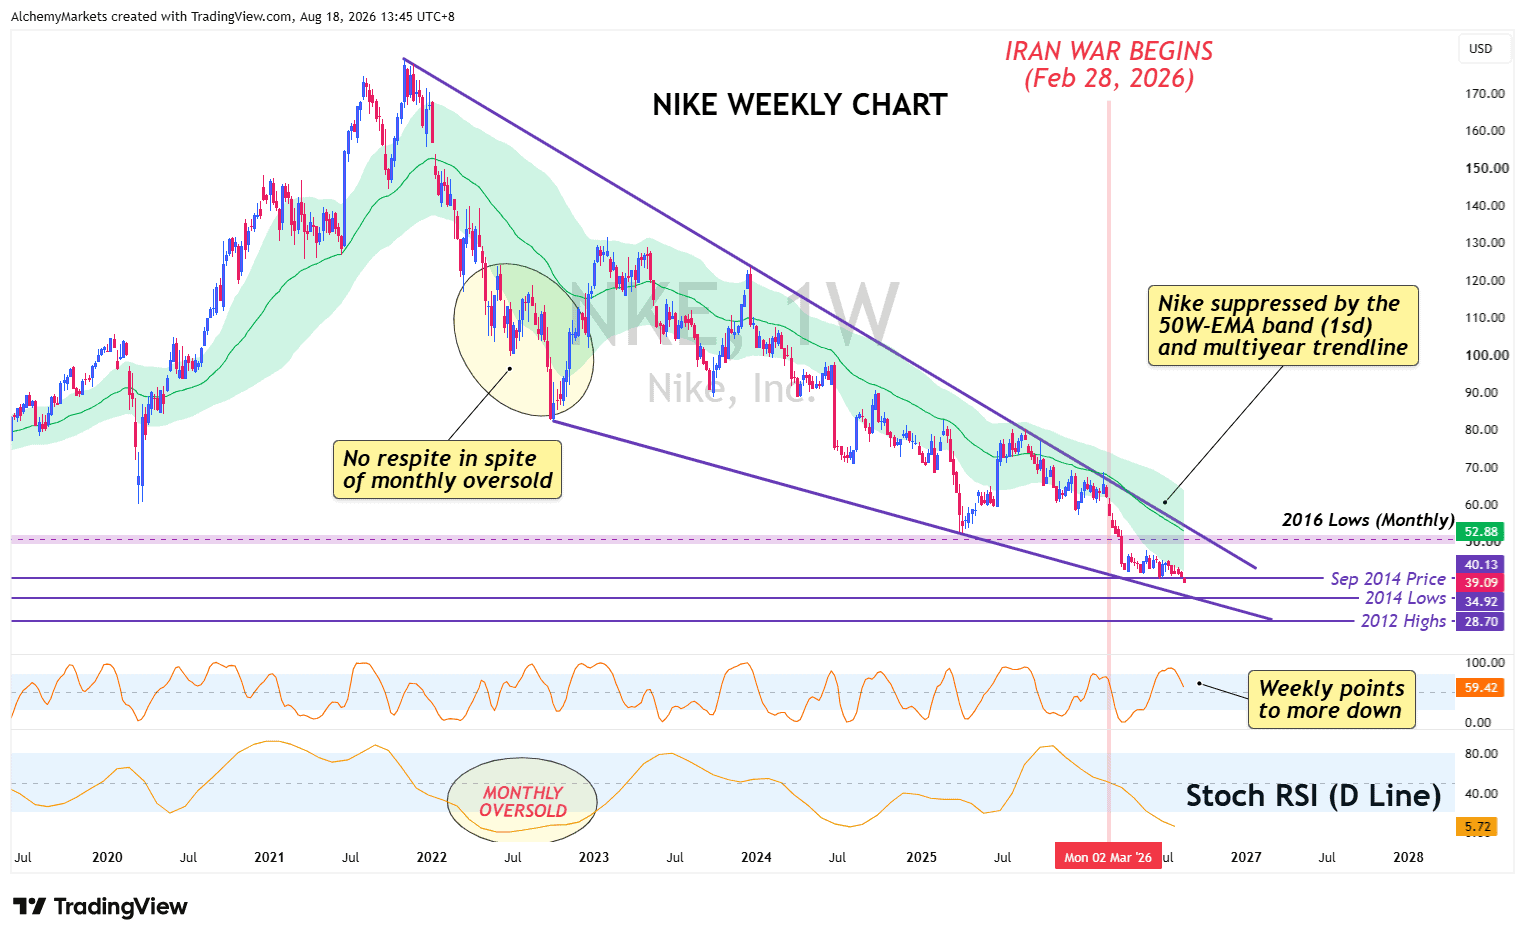
| NKE weekly chart. Monthly oversold conditions have previously persisted while the weekly structure stayed bearish. |
The more useful trend filter remains the 50-week EMA band, set via the Bollinger Bands® indicator with the 50 EMA as the basis and standard-deviation bands set to one instead of two.
Nike has spent most of the post-2021 decline below it, and price is still below that band now. Until the stock can reclaim it and then challenge the longer-term trendline drawn from the 2021 and 2023 highs, the larger structure remains bearish.
More importantly, there is no especially clean support level being defended at the current price. The old $39–40 area has already been breached rather than firmly held. The two clearer levels below are around $34.92, near the 2014 lo ws, and roughly $28.70, around the 2012 highs.
Should NKE finally catch a tailwind there, things get more interesting… Especially if price reaches one of those levels at roughly the same time as the falling trendline support.
That would give the stock a stronger technical base to work from, with a recovery towards the 50-week EMA, and potentially the upper trendline.
The Nike that Reached $179 Looked Very Different
To understand why the stock could trade near $179 in 2021, it helps to remember what investors thought they were buying at the time.
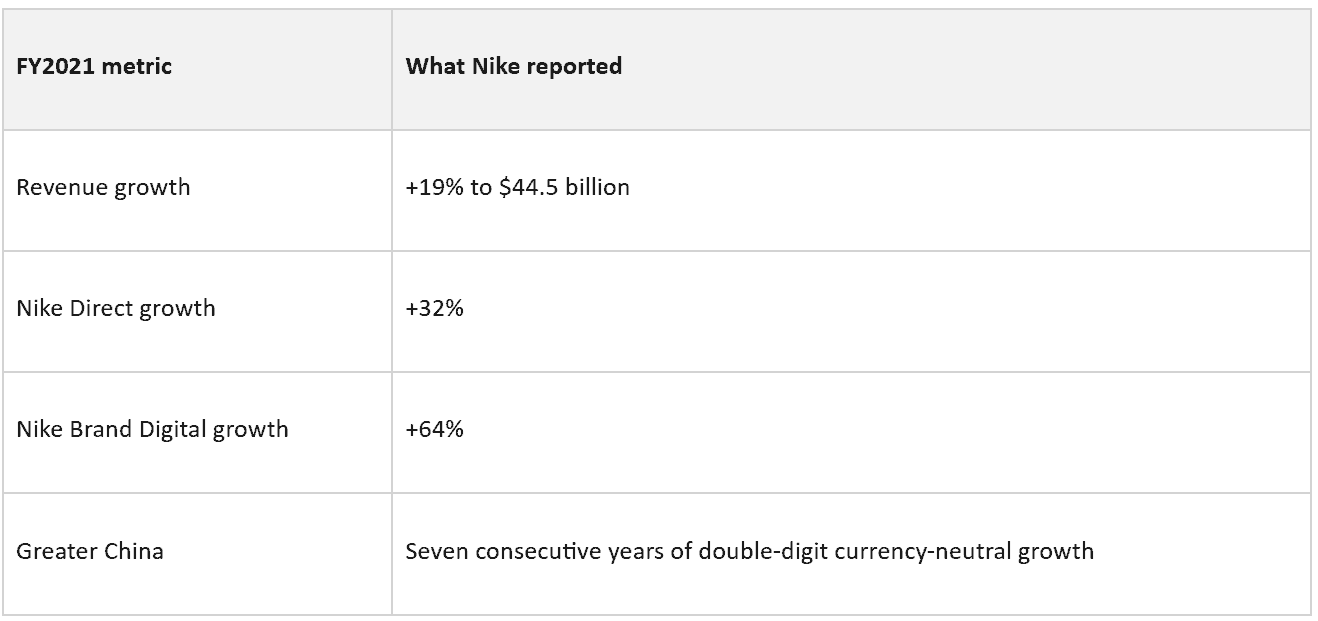
Digital sales were exploding. Direct-to-consumer was growing quickly. China looked like a long-term growth engine.
Nike’s move away from wholesale retailers looked less like a risk and more like the company had found a way to keep more of the economics for itself.
That is a very different story from the one investors are being asked to price today.
What Actually Went Wrong
Nike pushed hard into direct-to-consumer just as competitors were becoming much better at winning attention in the places Nike had started to deemphasise.
The obvious benefit of selling directly is control. Nike gets the customer relationship, the data and more say over pricing. The less obvious cost is that Nike is now missing out on shelf space, product discovery and advertising.
When Nike reduced some of that wholesale exposure, brands such as Hoka, On, Adidas and New Balance had more room to get in front of customers.
The product cycle made the problem worse. Nike spent years leaning on established franchises such as Dunk, Air Force 1 and parts of Jordan lifestyle.
When demand cooled, old inventory had to be cleared through markdowns, discounts and wholesale returns, hurting the brand’s premium image.
Nike is now rebuilding wholesale relationships and repositioning Digital as a healthier full-price channel to undo the damage.
Nike’s Rivals Are Not Having the Same Problem
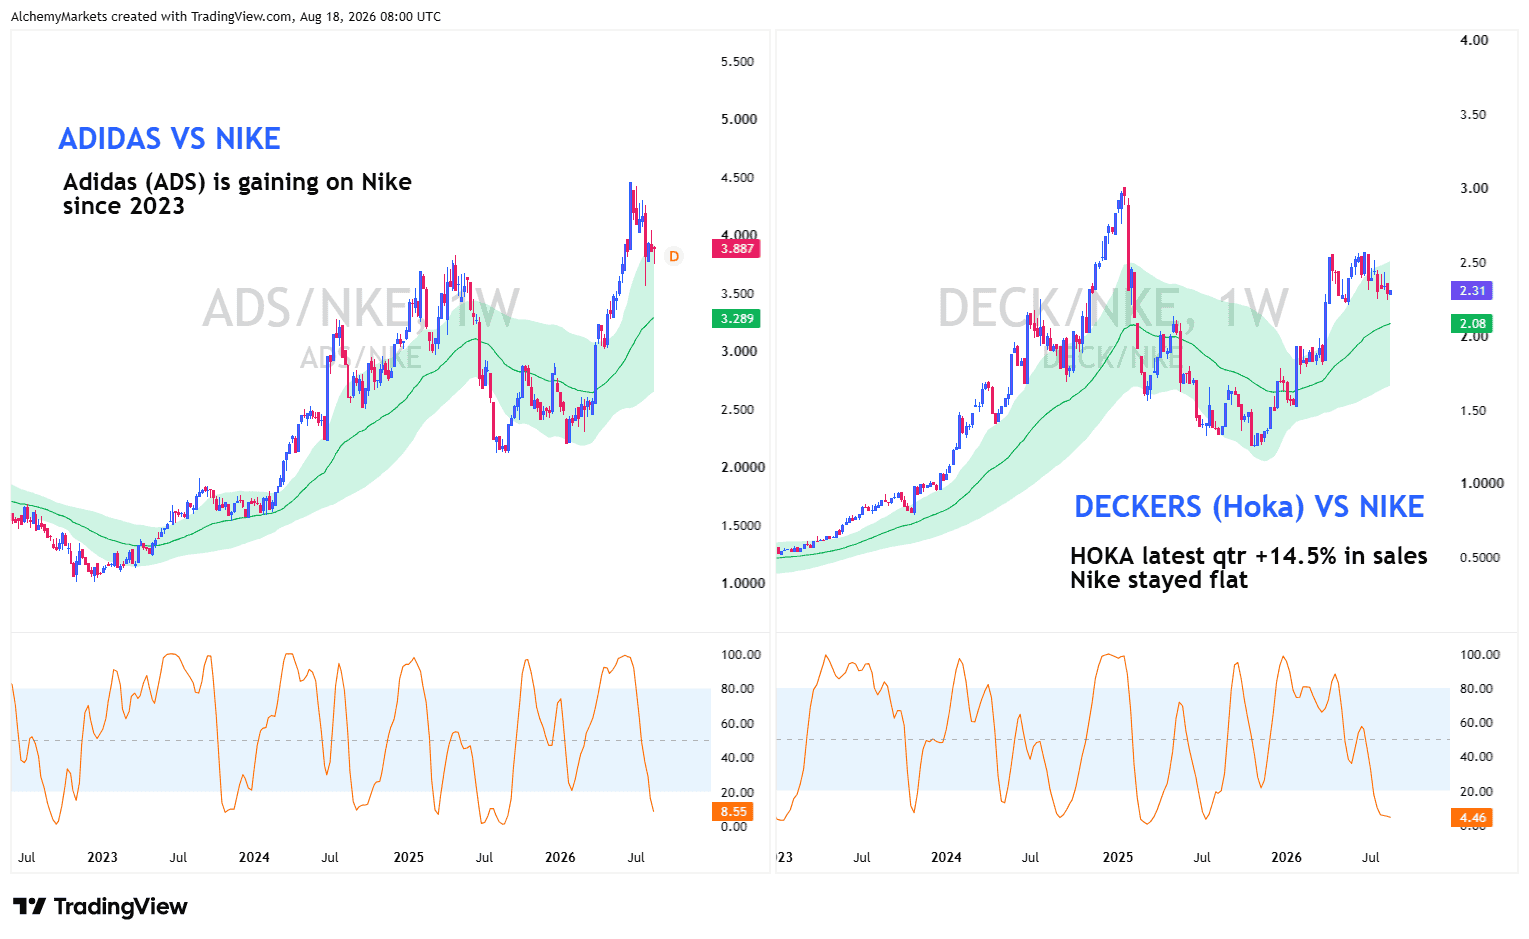
| Relative performance. Adidas and Deckers have both materially outperformed Nike over the longer term. Deckers owns Hoka and UGG, so DECK/NKE is a portfolio comparison rather than a pure Hoka ratio. |
The problem is that Nike’s relative performance is much weaker than its competitors.
Adidas finished 2025 with record sales of €24.8 billion, while operating profit rose 54%. Hoka sales were still up 14.5% in Deckers’ latest reported quarter.
So the cleaner conclusion is that consumers are becoming more picky across the category.
It’s become a much more competitive space for Nike, and Nike needs to prove itself to be a market leader again.
China: Once a Bull Case for Nike, Now a Fragility
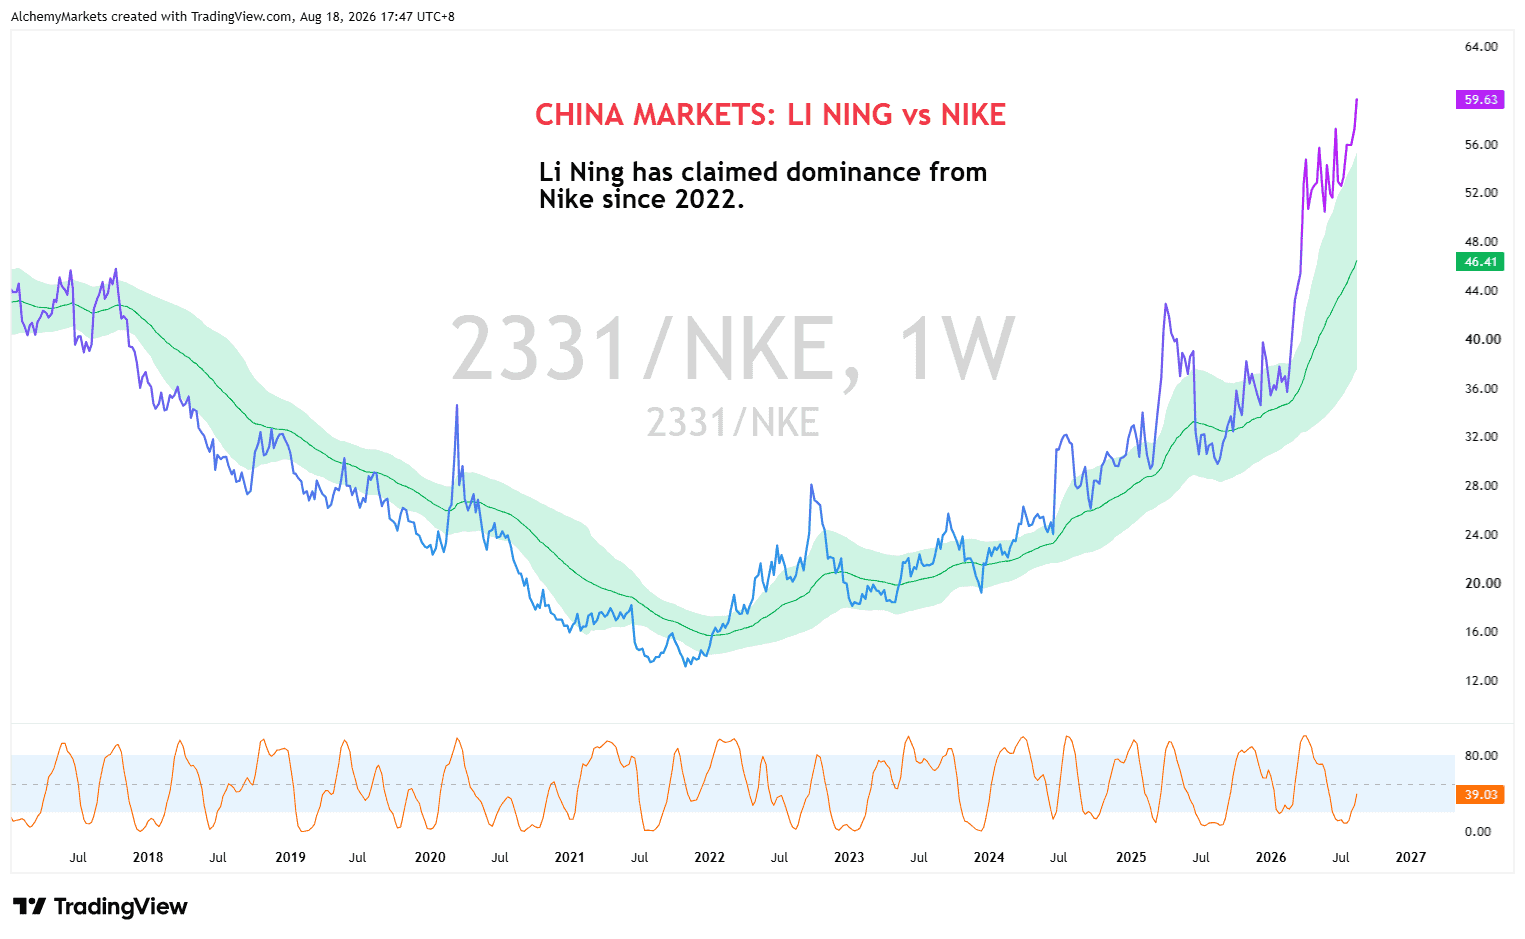
| Li Ning vs Nike. Li Ning has dramatically outperformed Nike in market terms since the relative ratio bottomed around 2021–22. The ratio does not prove absolute market-share dominance on its own, but it fits the broader evidence that Chinese sportswear brands have become much more competitive. |
China used to be one of the main reasons investors were willing to pay a premium for Nike.
In FY2021, Nike’s growth in Greater China had just completed its 7th straight year of double-digit currency-neutral growth.
In Q3 of 2021 alone, revenue in China rose 42% on a currency-neutral basis. Fast-forward to today and the latest quarterly decline is around 17%.
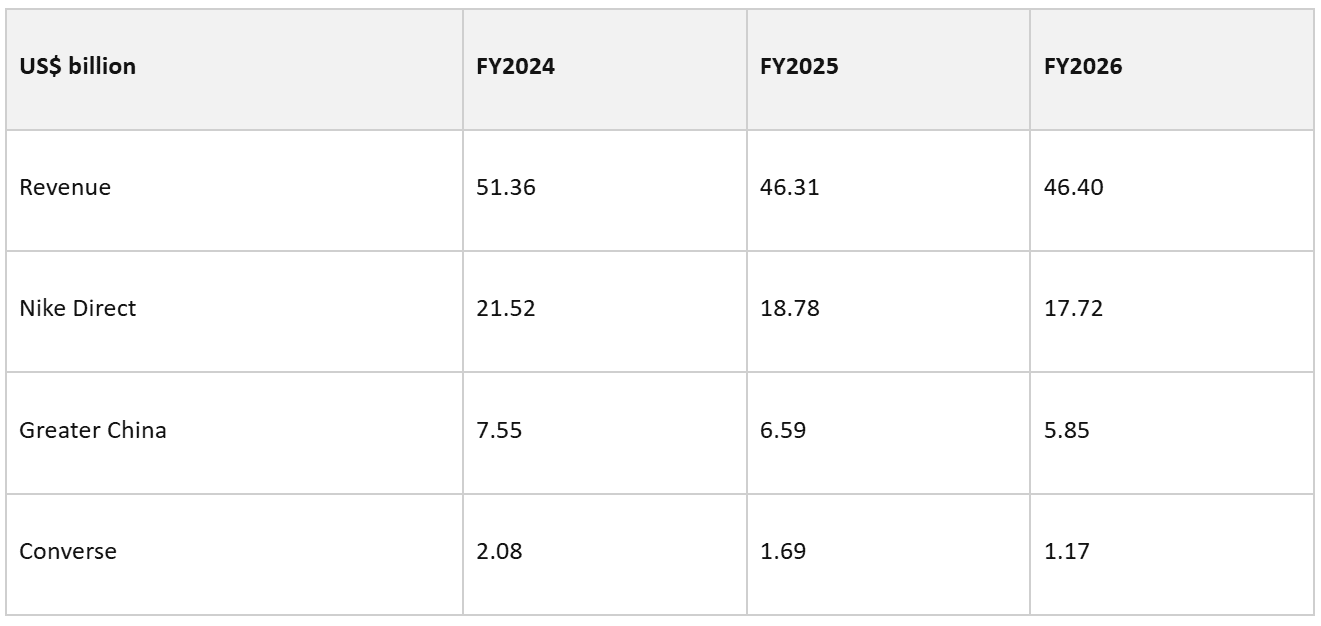
Greater China revenue has fallen from roughly $7.55 billion in FY2024 to $5.85 billion in FY2026.
Part of that is macro. Chinese retail sales have slowed sharply, the property downturn has weighed on household confidence, and consumers have become more cautious about discretionary spending.
But Nike’s problem is not simply that Chinese consumers stopped spending. Domestic brands such as Anta and Li Ning have become stronger competitors at the same time.
Back in 2021, China was one of the reasons investors were willing to pay a premium for Nike. Today, the discussion is more about when how Nike’s leadership stops shrinking in China.
Nike’s Strategy For a Turnaround
Nike’s turnaround is based on a reversing the digital sales strategy it spent years building.
Nike Direct itself was not new. DTC (Direct to consumer) revenue was already $6.6 billion in FY2015.
The bigger change came with the 2017 Consumer Direct Offense, which targeted “2X Direct”, followed by the 2020 Consumer Direct Acceleration, when Nike pushed the direct model much harder.

That worked beautifully when demand was strong. It looked a lot less clever once Nike had weaker products, more discounting and less support from wholesale retailers.
Nike is now trying to restore the balance.
It is rebuilding wholesale relations, tightening inventory buys and reducing promotional product rather than treating Direct and wholesale as competing channels.
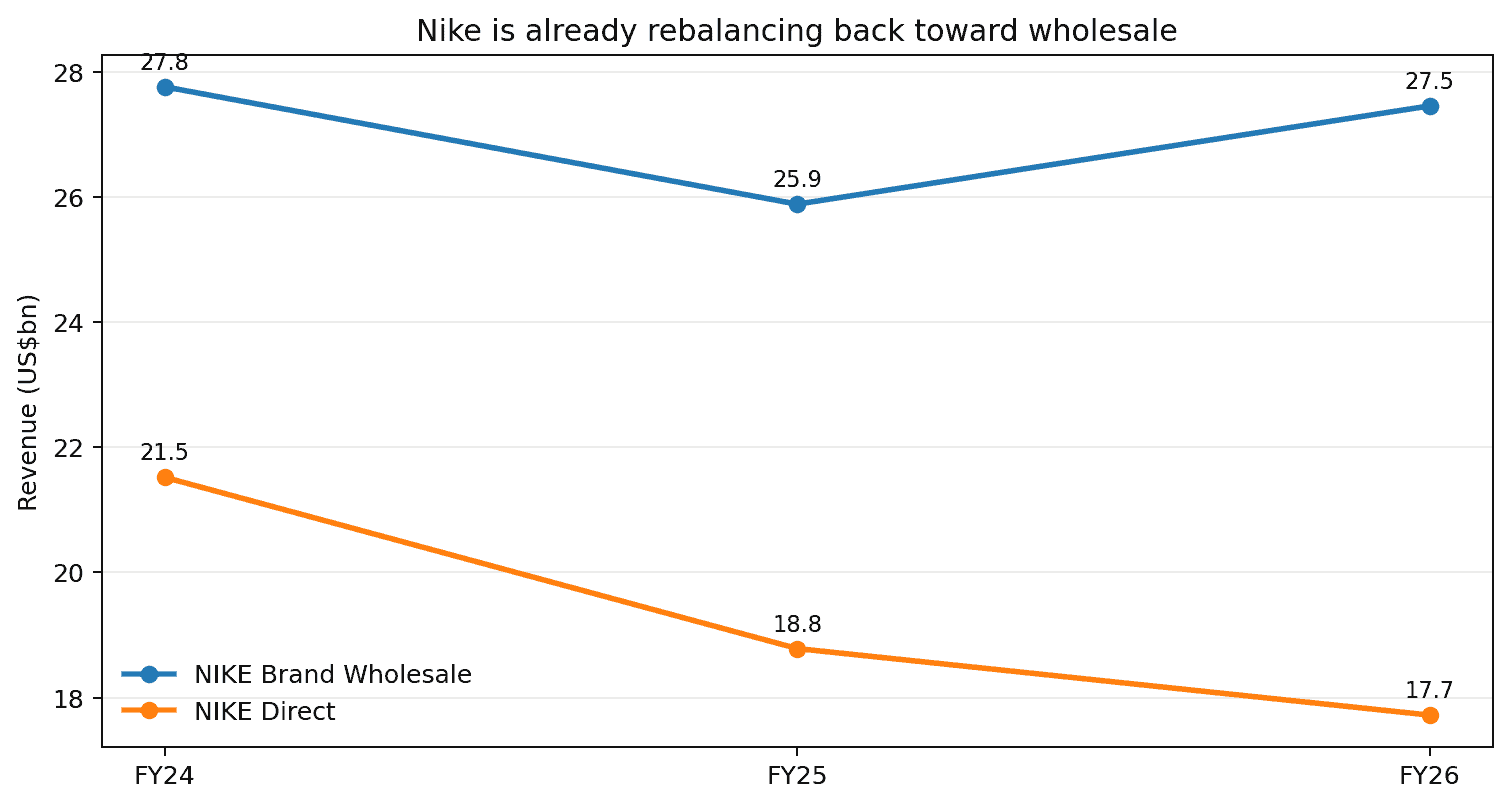
| Channel rebalance. Nike Brand wholesale fell sharply in FY2025 before recovering in FY2026. Nike Direct kept shrinking, which is exactly why the turnaround now looks more like “Direct plus wholesale” rather than “Direct instead of wholesale.” |
The repair also has to change how customers behave. Years of easy promotional inventory made waiting for a discount increasingly rational.
Nike says it has since cut off-price Digital sales in EMEA by more than 50%, while full-price realisation improved by around 15 percentage points.
The bullish interpretation is that Nike is fixing both sides of the problem at once: putting products back in the places customers already shop, while gradually undoing some of the discount-driven behaviour it spent the past several years encouraging.
Nike is Stabilising. Can They Scale into Growth?
Recent financial results suggest Nike is stabilising rather than recovering.
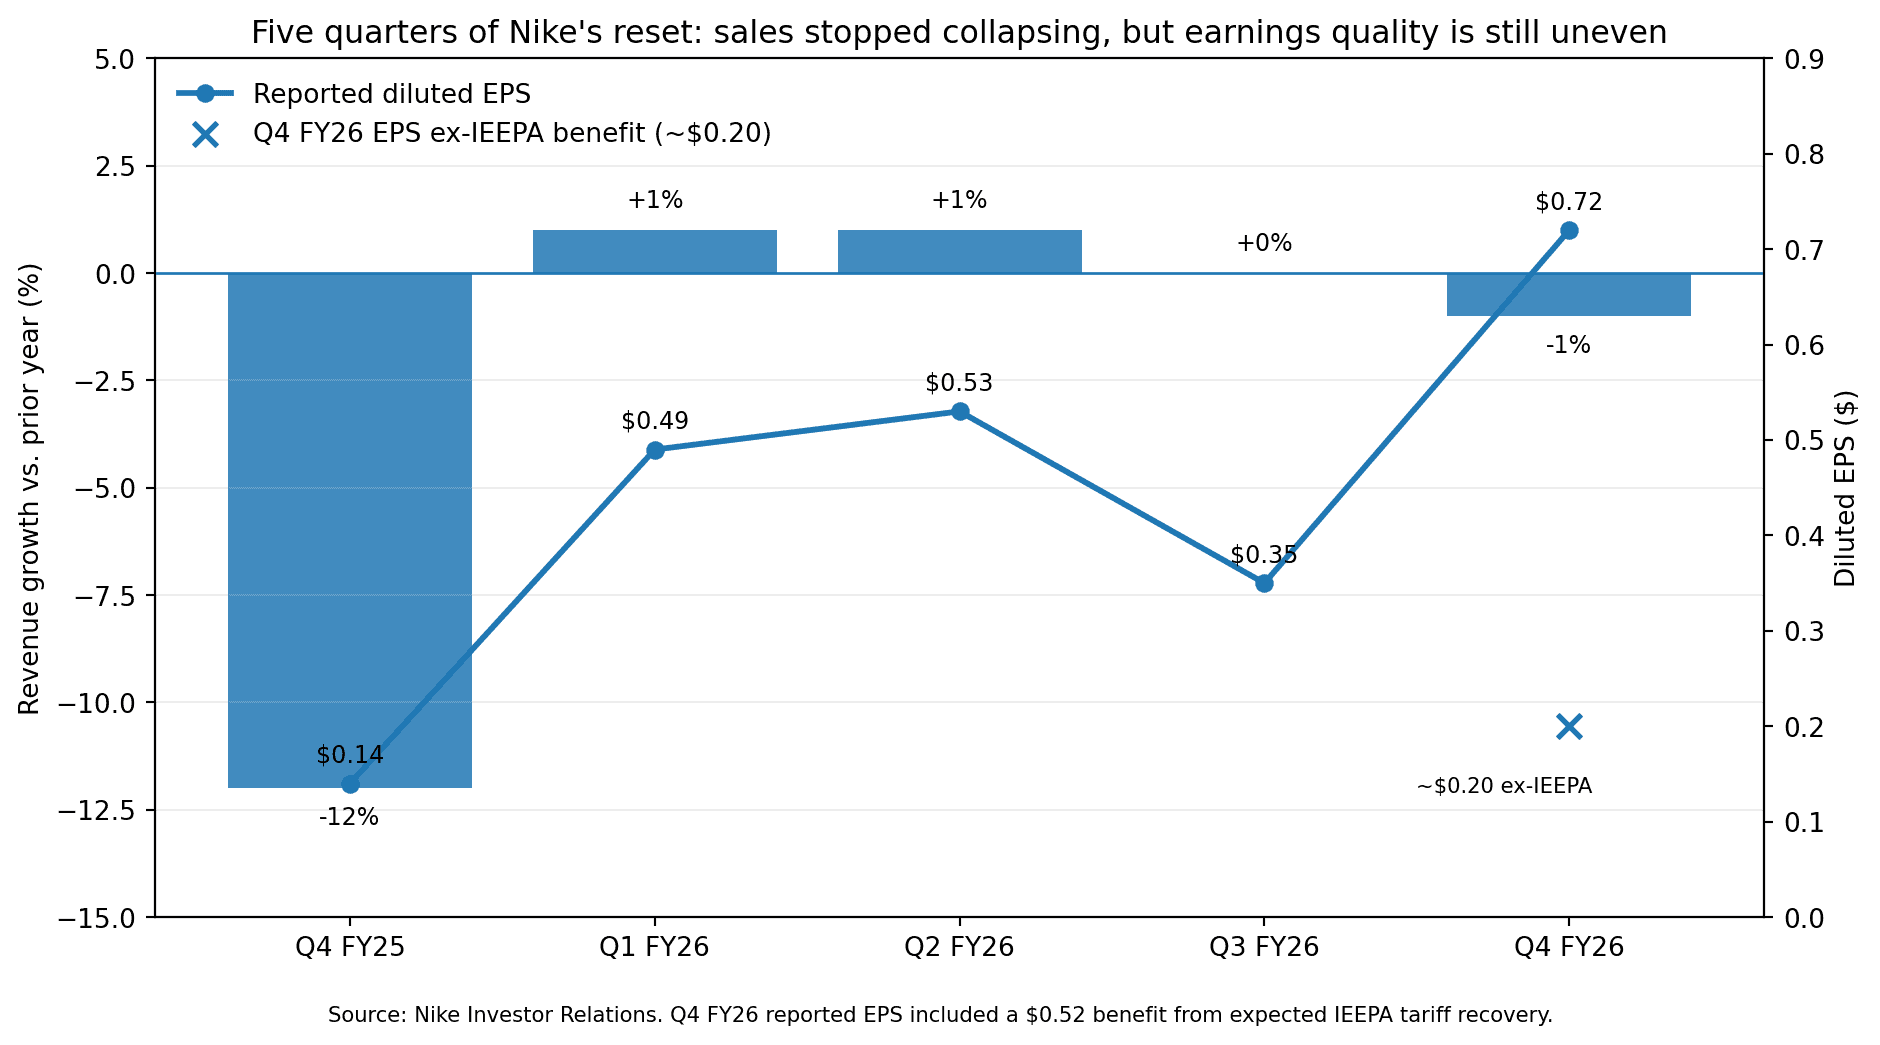
| Five-quarter reset. Revenue growth moved from a 12% decline in Q4 FY2025 to roughly flat across the following year. Reported EPS improved, but the latest Q4 FY2026 figure was flattered by a large tariff-related benefit. |
Revenue growth across the last five reports went from -12% to approximately +1%, +1%, 0% and -1%. That is progress, but it is not growth yet.
Reported Q4 FY2026 EPS came in at $0.72, but Nike said roughly $0.52 of that came from the expected recovery of IEEPA tariffs. Excluding that benefit, the underlying earnings picture was much less impressive.
The more convincing evidence is coming from product innovation, particularly in Running.
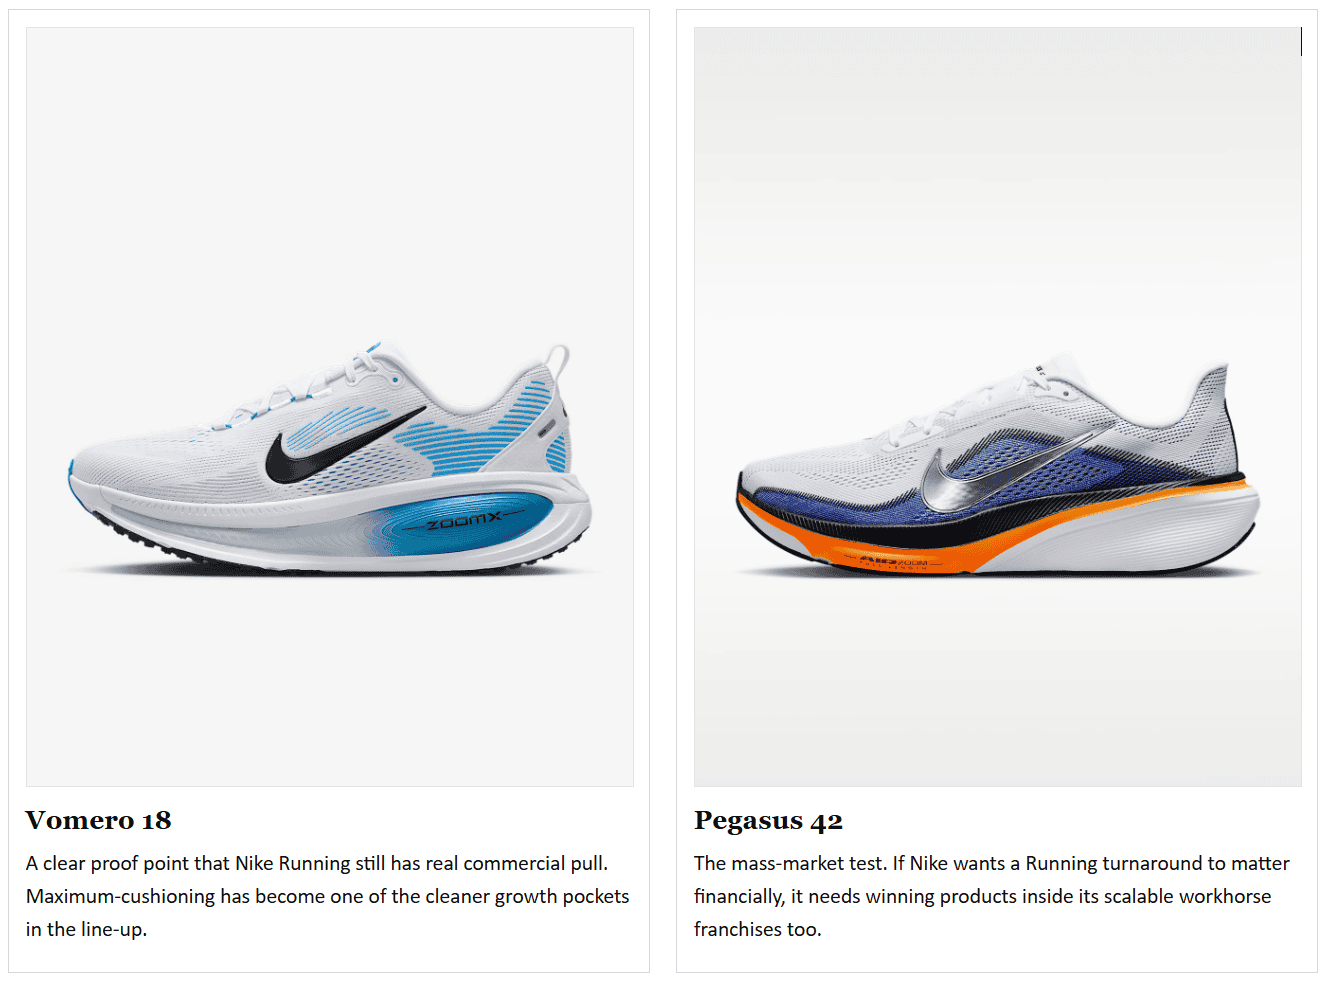
Nike has spent the past couple of years simplifying its road-running range around three clearer franchises: Pegasus for responsive cushioning, Vomero for maximum cushioning and Structure for support. More recent launches such as the Vomero 18 and Pegasus 42 have continued that refresh, giving Nike a more focused answer to the specialist running brands that have been taking share.
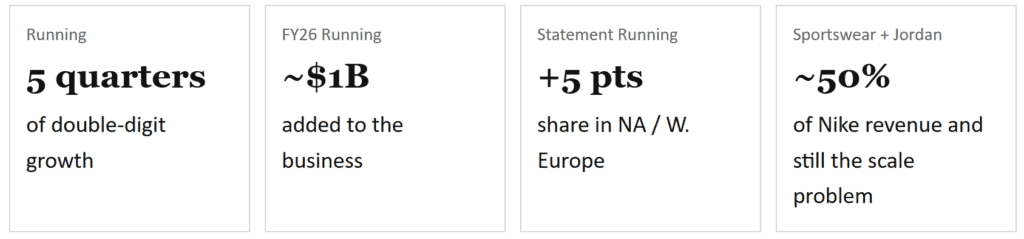
And there are signs that the strategy is working. Nike Running has now delivered five consecutive quarters of double-digit growth, adding roughly $1 billion to the business over that period.
Nike also says it gained five percentage points of statement-running footwear market share across North America and Western Europe in FY2026, more than any other top-five brand.
The problem is scale. Running is one part of a roughly $46 billion company.
Sportswear and Jordan Streetwear still account for around half of Nike’s revenue and remain the much bigger test of whether this product-led turnaround can spread across the business.
At the Lows, Watch for Nike to Get Less Bad
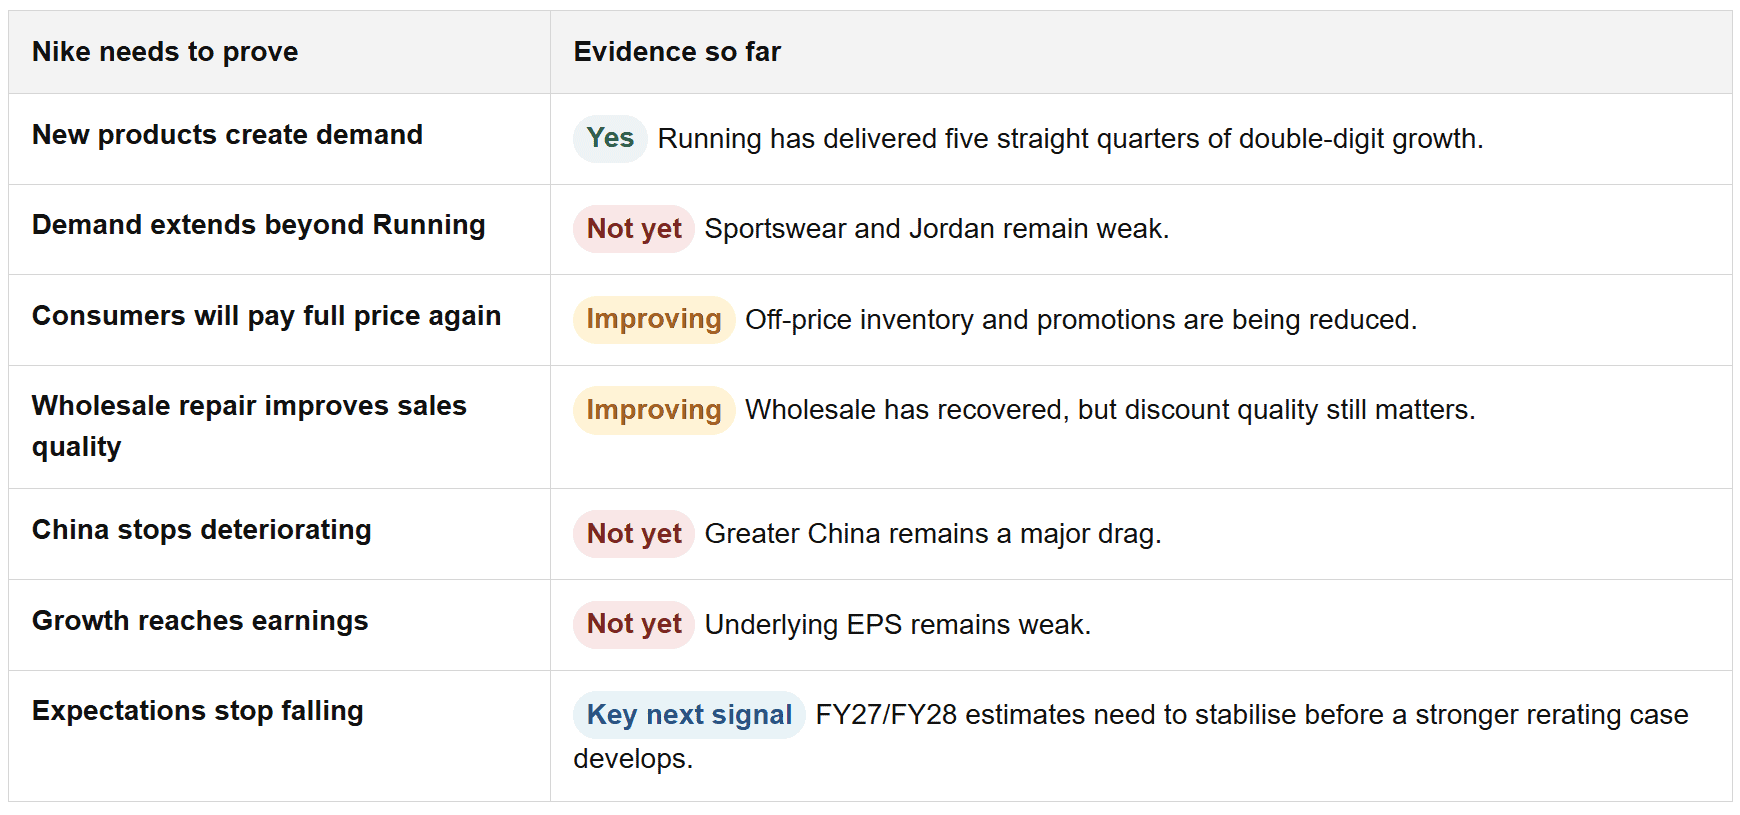
For Nike to become a credible turnaround long, the numbers do not need to become great immediately.
They first need to stop deteriorating, aka, demonstrate clear signs they are getting “less worse”.
Wait for the Break
At these levels, the risk-reward from shorting Nike lower is simply becoming less attractive. The stock is already heavily sold, while parts of the business are beginning to improve.
So right now, Nike is kind of in no-man’s land.
The cleanest technical test remains the descending trendline. As long as NKE stays below it, sellers still control the larger structure.
That signal becomes more interesting if it arrives alongside the fundamental framework above: Chinese sales getting less bad, broader product demand, healthier full-price selling and earnings expectations finally stabilising.