


Scritto da:

- Chart of the Day
- Maggio 21, 2025
- 3 min di lettura
DXY Crashes Below Key Support – Here’s Why It’s Falling and What’s Next
What’s Going On With the Dollar?
The U.S. Dollar Index (DXY) has taken a sharp dip this week, breaking below key trendline support. One major catalyst behind this movement is a credit rating downgrade by Moody’s, a top-tier credit rating agency. Let’s break it down step-by-step so you can understand why this is such a big deal.
Why Did Moody’s Downgrade the U.S.?
1. What happened?
Moody’s issued a credit rating downgrade for the U.S. government. Think of this like your personal credit score dropping—from “excellent” to just “very good.” It’s not catastrophic, but it’s a warning sign.
2. Why did they do that?
The U.S. government has over $36 trillion in debt, and with plans for potential tax cuts and increased spending, that number could rise even higher. Moody’s is concerned about how the government plans to manage such a large amount of borrowing.
3. Why does this matter?
When a country’s credit rating drops, it’s seen as riskier to lend to. Investors then demand higher interest rates to compensate for that risk. That’s why yields on 30-year U.S. Treasury bonds have surged past 5%—a big and fast move.
4. And how does this affect the dollar?
As confidence drops, foreign investors begin to sell U.S. assets—including the dollar. This triggers a decline in dollar value compared to other currencies around the world.
In simple terms:
“The U.S. just got a warning for having too much debt. Investors are now a bit more cautious, so they’re selling U.S. bonds and dollars—which is why the dollar’s been dropping this week.”
Technical Breakdown: DXY Breaches Trend Channel Support
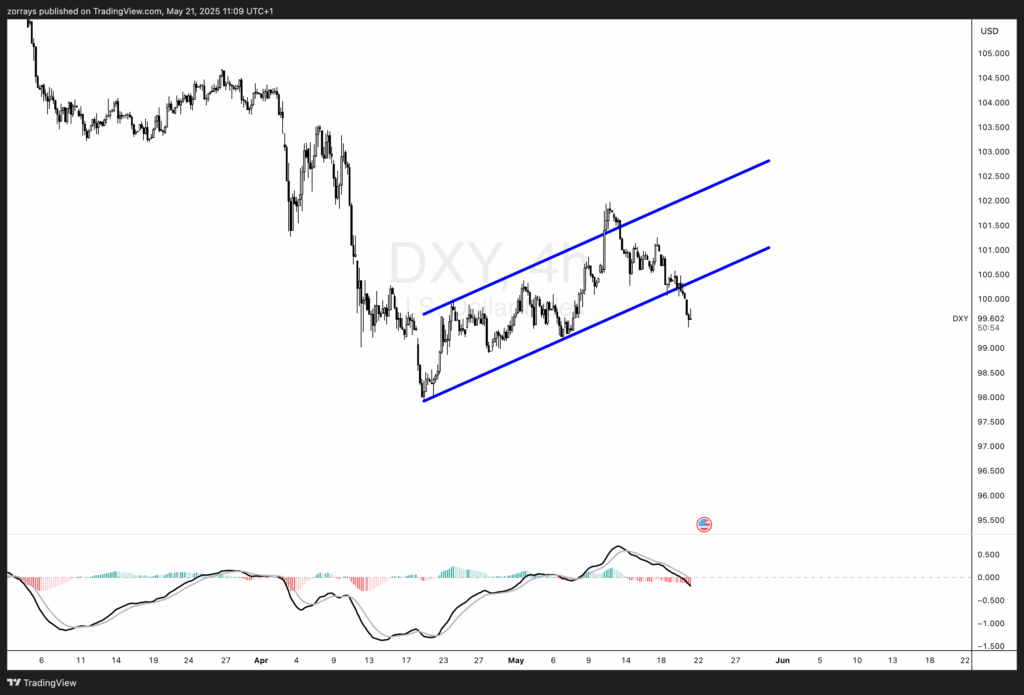
Looking at the 4-hour chart of the U.S. Dollar Index (DXY), we can see a clear breakdown of the rising channel (marked in blue). Here’s what stands out:
1. Price Structure and Channel Break
- The dollar had been consolidating within a rising channel for most of May.
- That structure was violated to the downside, confirming a bearish breakout.
- Price has cleanly broken below the lower trendline, which often signals continuation of downside momentum.
2. Momentum Indicator: MACD Bearish Crossover
- The MACD (Moving Average Convergence Divergence) has formed a bearish crossover—the signal line has crossed above the MACD line.
- This indicates negative momentum is increasing.
- The histogram is also printing red bars, confirming bearish divergence and loss of bullish pressure.
What to Expect Next: More Downside Likely
Given both the fundamental backdrop (credit rating fears, rising debt concerns) and technical confirmation (channel breakdown + bearish MACD), the dollar is set for further downside in the short to medium term.
Key levels to watch:
- 99.00 – psychological round number and near-term support
- 97.80–98.00 – previous structure support from March/April
- Break below 97.00 – could trigger a deeper decline toward mid-95s


