Scritto da:


- Chart of the Day
- Novembre 17, 2025
- 2 min di lettura
BTC Breaks Major Bull Support: 50-Week Moving Average
Bitcoin (BTC) has broken down from the 50 weekly EMA, this has been a powerful support in 2024 and in 2025 — but this breakdown marks the first time Bitcoin has shown major weakness on a weekly basis.
What are the technical signs you should be watching?
Bitcoin Flips Bearish with Break of Weekly 50-EMA
Bitcoin (BTC) Weekly Chart:
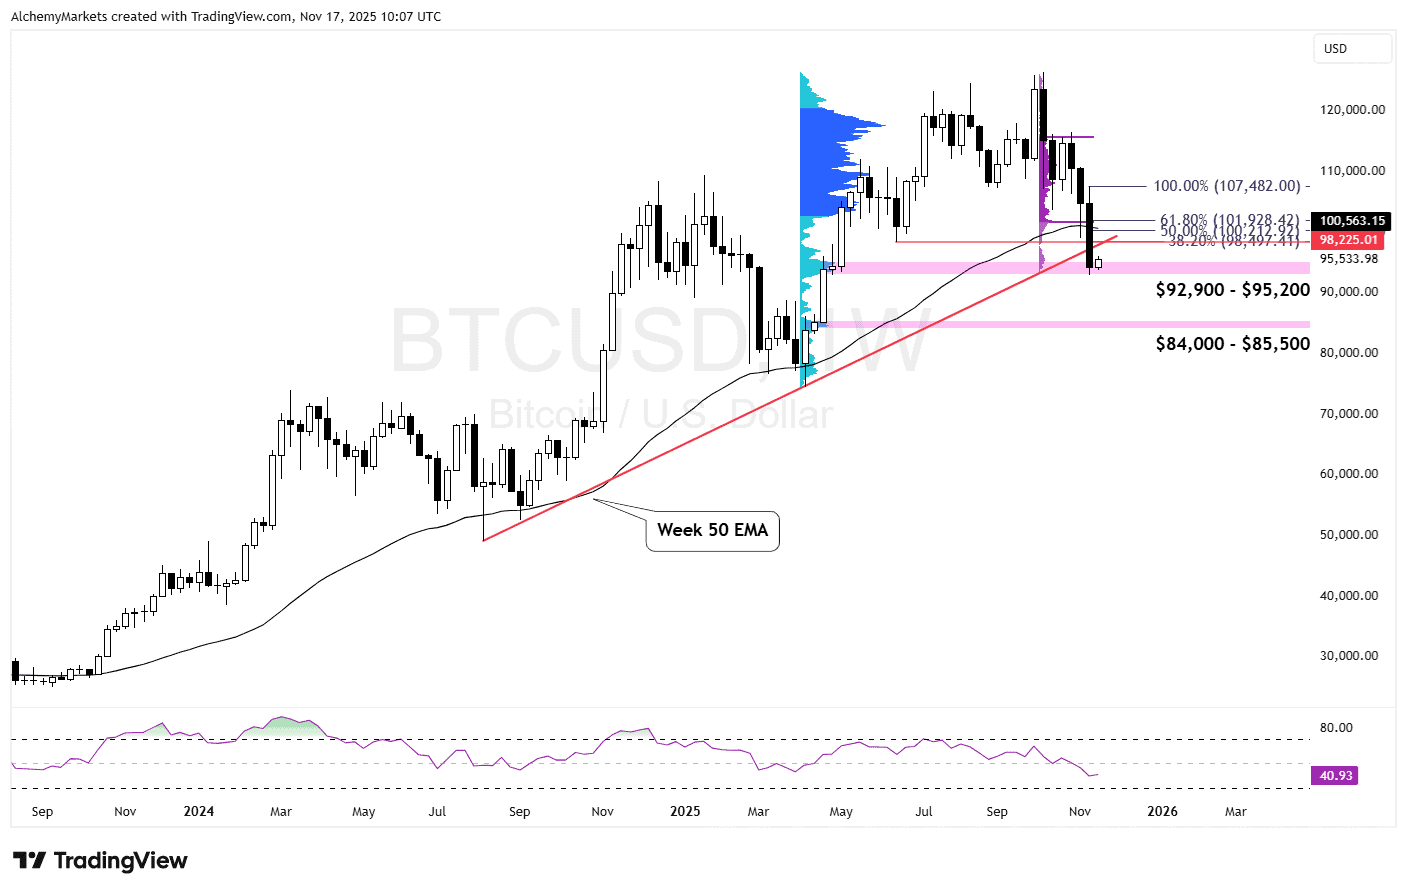
Bitcoin has broken down from two major supports formed in 2024 – 2025:
- Trendline support from 2024 – 2025 (highlighted in red)
- Weekly 50-EMA which acted as support from 2024 – 2025
All hope isn’t lost, we are actually at a support at the current zone, a high volume node support ($92,900 – $95,200), marked by a daily order block.
Should we retrace from here, we have a few resistances to watch:
- 38.2% Fib at $98,497 — Aligns with a previous low, trendline.
- 50% Fib at $100,212 — Aligns with weekly 50-EMA.
- 61.8% Fib at $101,928 — Aligns with the Value Area Low of the current decline.
Bitcoin Daily Chart:
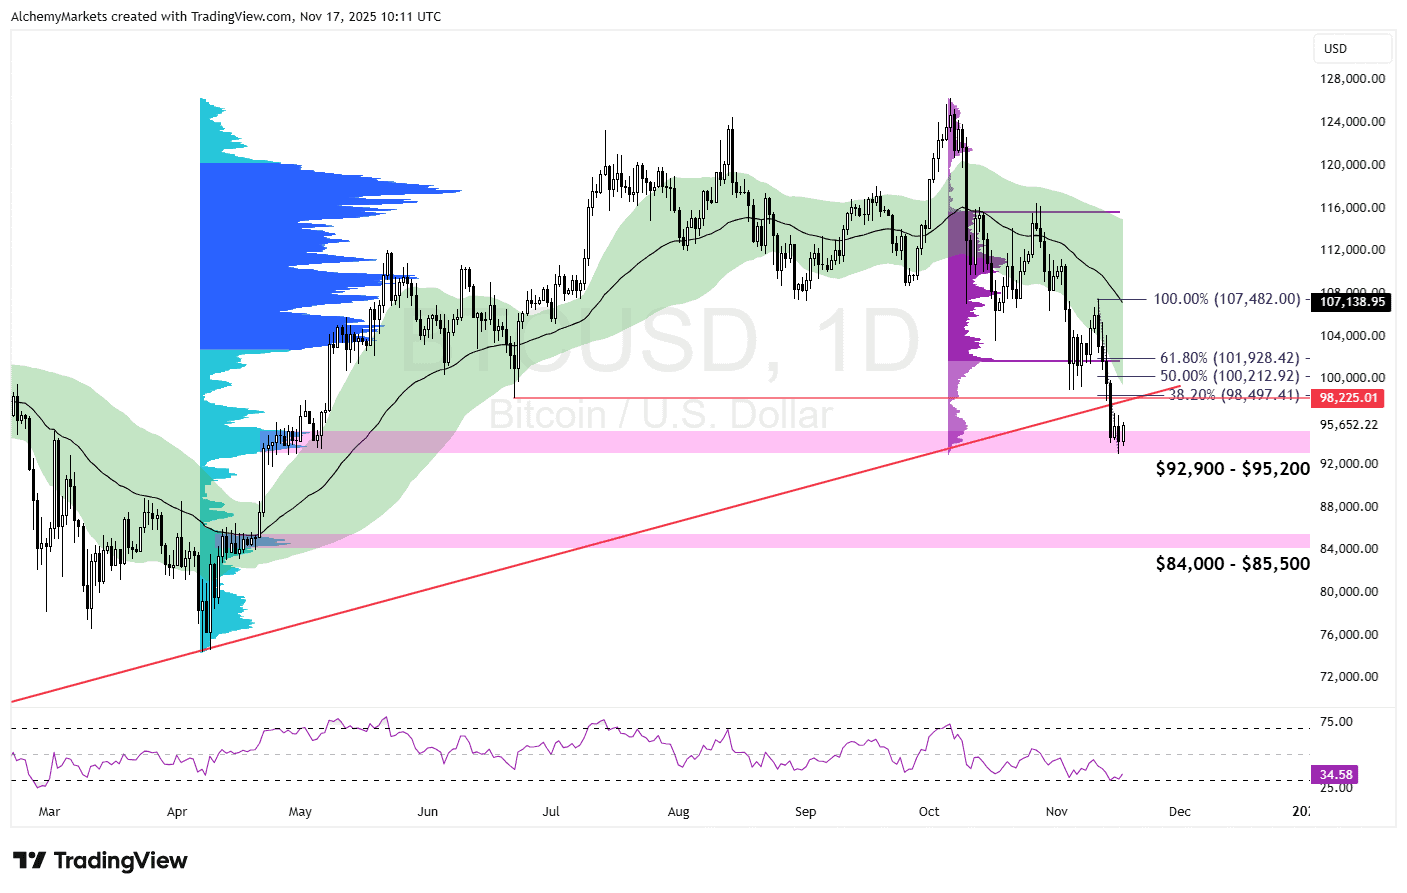
RSI on both the daily and weekly timeframes is deeply depressed but hasn’t actually bottomed below 30 yet. That keeps the door open for a sharp reversal, but it also means there’s still room for price to fall.
If the selloff continues, the next key downside area sits around $84,000–$85,500, where a high-volume node could attract buyers.
In the short term, watch whether the price can hold above $92,900. If we get a retracement, a genuinely bullish trend only comes back into play if price can reclaim and close above the prior high at $107,482 and, ideally, break and hold above the weekly 50 EMA.