


Scritto da:


- Chart of the Day
- Dicembre 31, 2025
- 3 min di lettura
Symmetrical Triangle on Bitcoin: $103K and $75K in Sight
At first glance, it does look like Bitcoin might be forming a low here. Price has been sitting around the same area for a while, which naturally pulls people into bottom-calling.
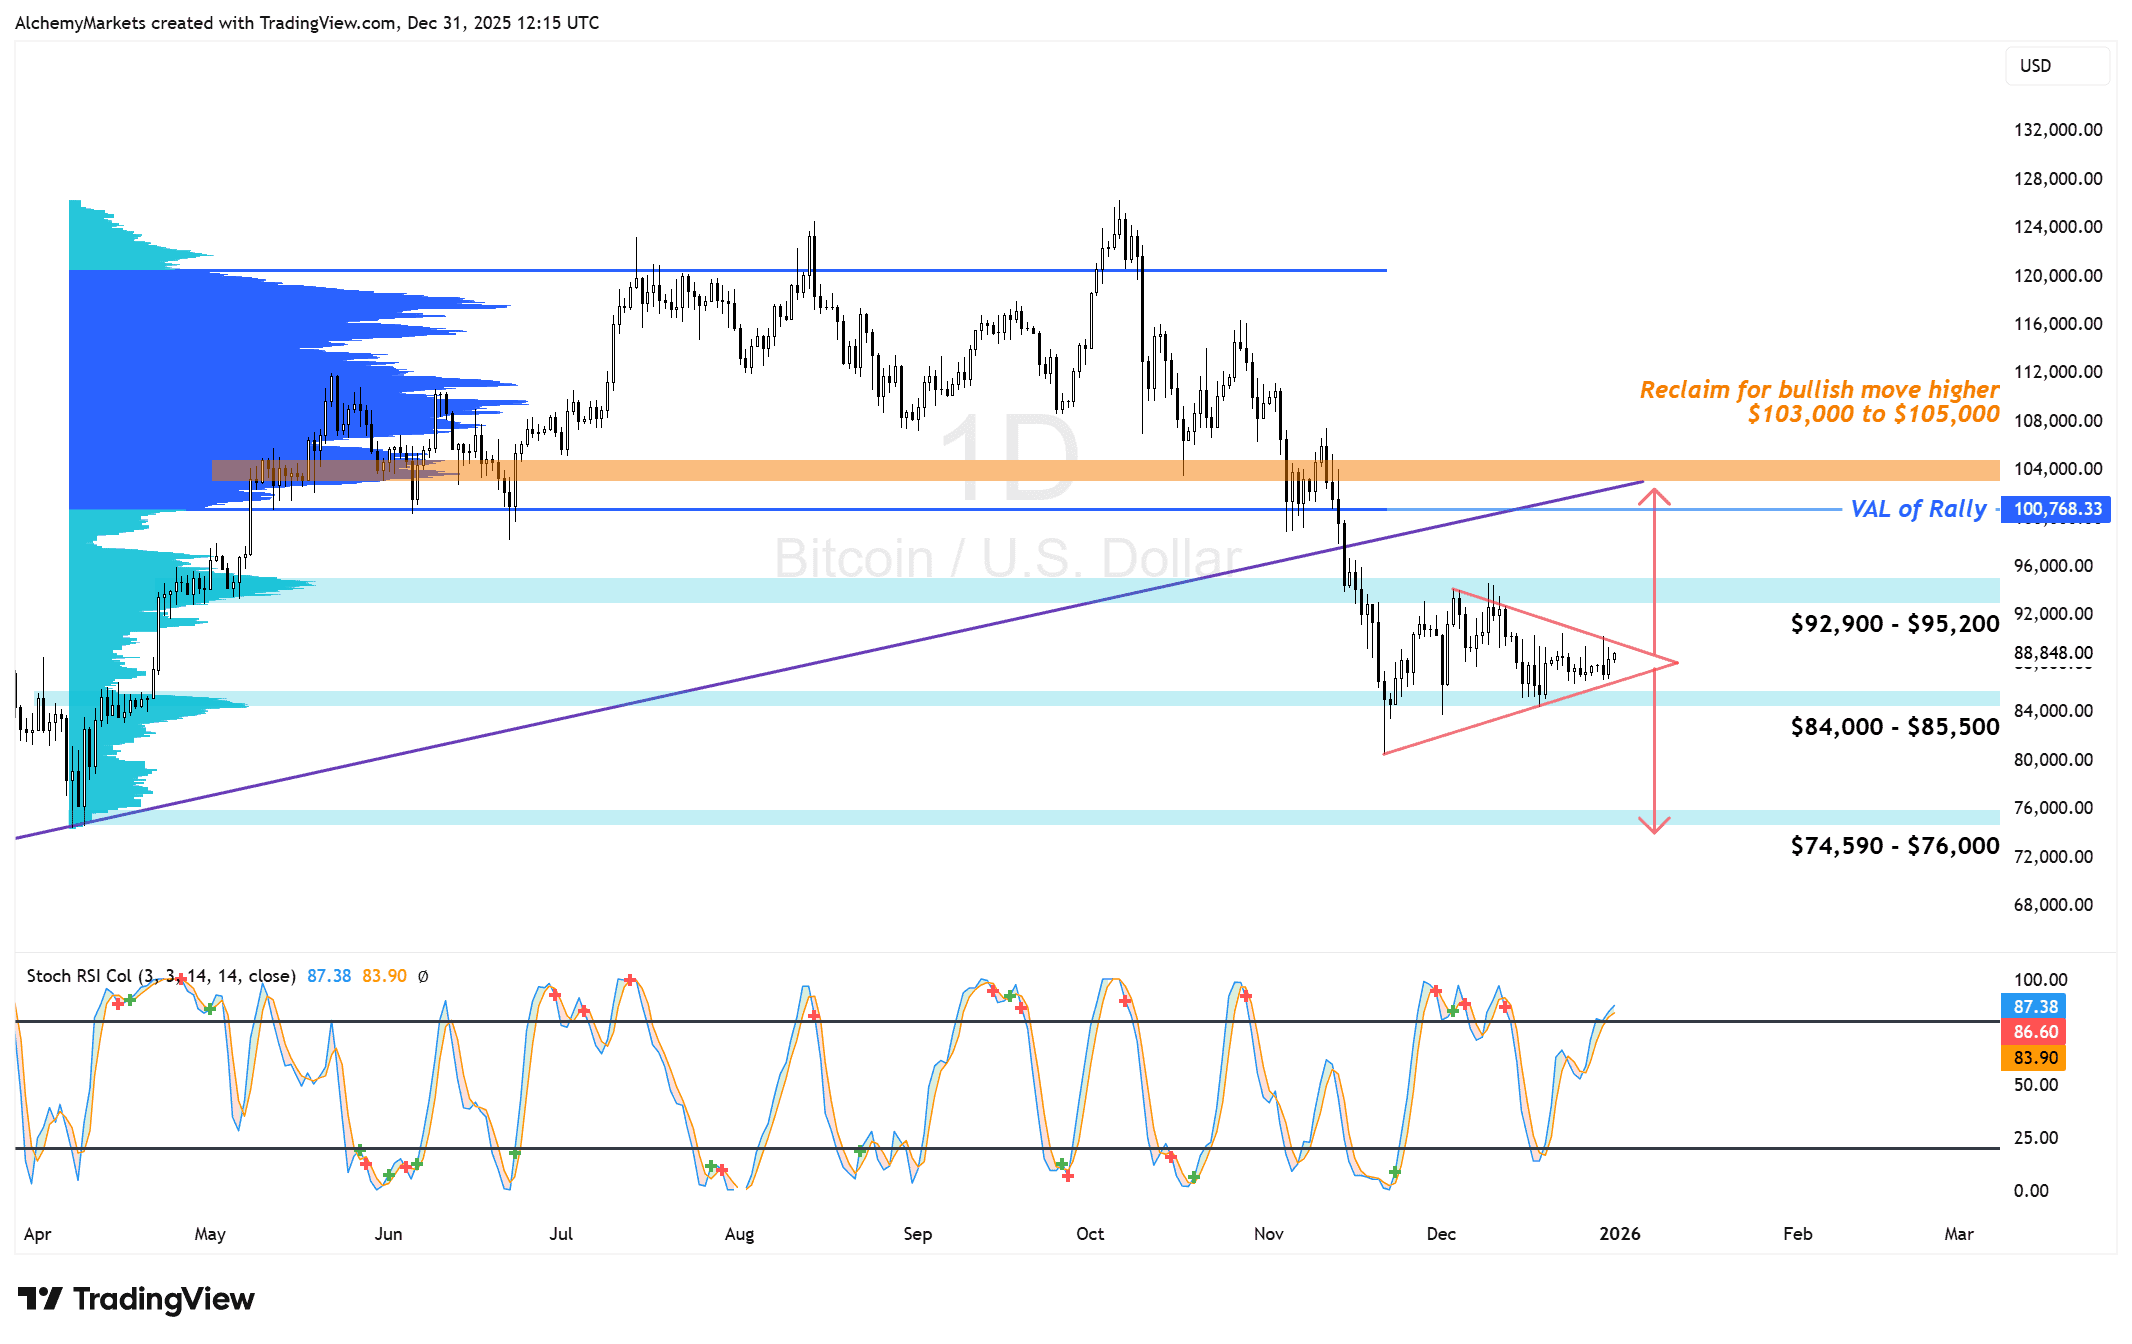
But if we take a step back and actually try to identify a pattern, the closest thing on the daily chart is a symmetrical triangle.
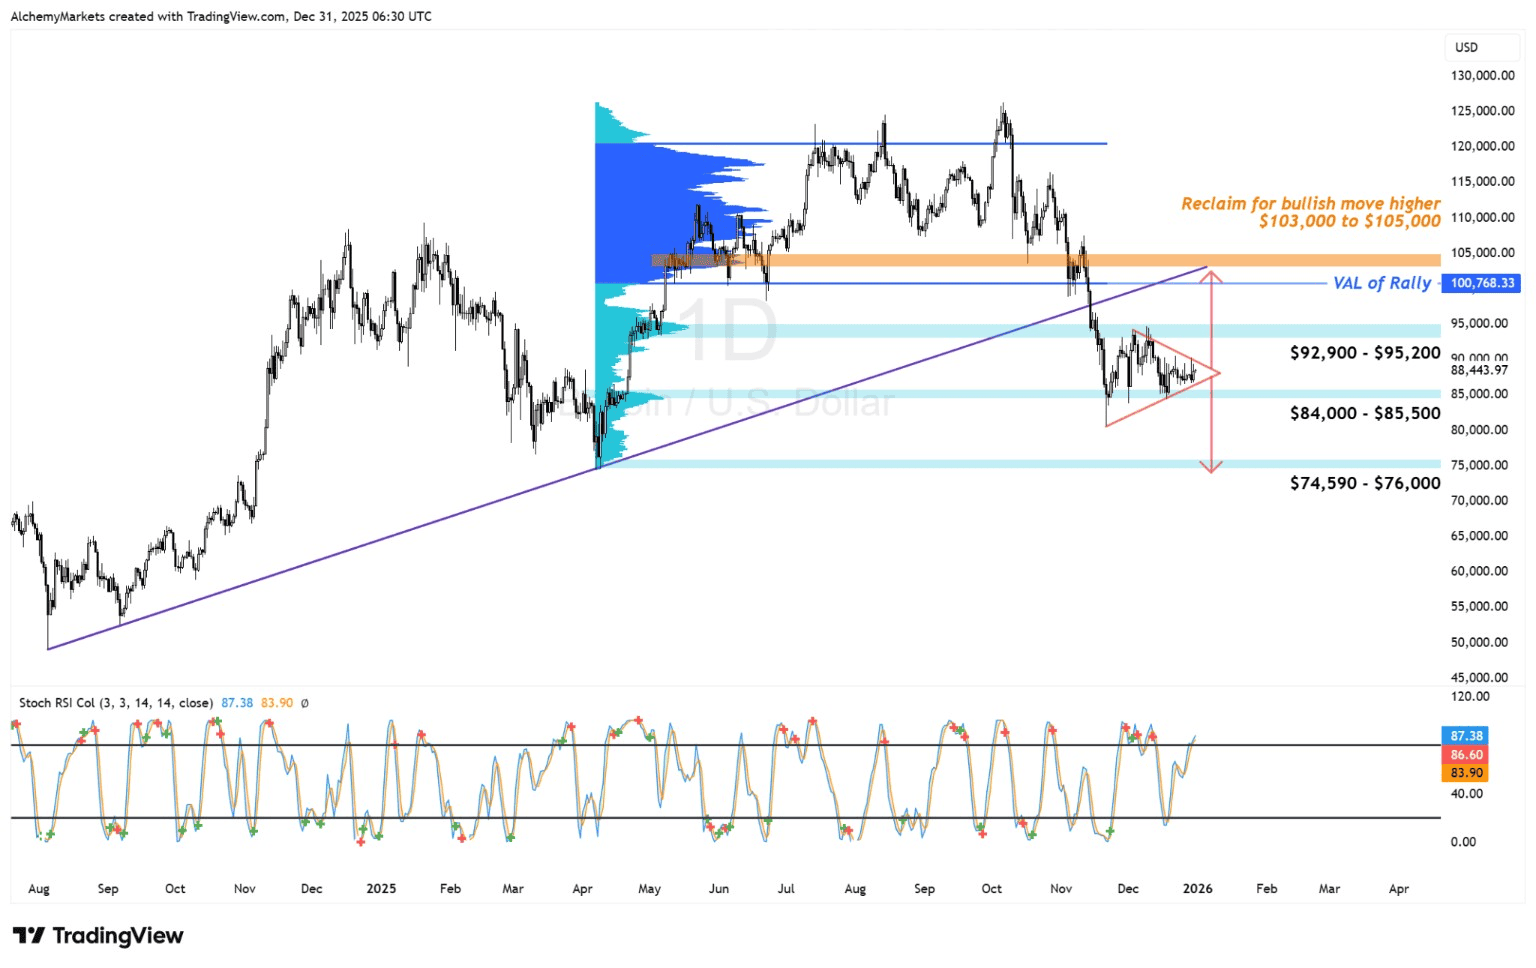
Yes, one of the wicks pushed higher than the rest. And if you drew this strictly wick to wick, you could argue it leans slightly directional. But looking at the most recent candles, and especially the last two rejections, it behaves much more like a symmetrical triangle than a clean trend continuation.
What This Structure Is Saying
A symmetrical triangle is price compressing. It’s the market getting ready for a move, not making one yet.
This structure formed after a strong move down from the October 2025 high. That context matters. These patterns tend to resolve in the direction of the original impulsive move more often than not.
Some traders might interpret this as a bear pennant instead. That’s fair. The message is the same either way. Compression is happening, and what matters next is the expansion.
If Price Breaks Higher
If Bitcoin pushes higher from here, the first area that really matters is $103,000 to $105,000.
This zone is marked by a large high-volume node from the Fixed Range Volume Profile (measuring volume during the April Rally) and the macro trendline. It’s also where prior support flipped into resistance. If price can break into this area and actually hold above it, that would be meaningful.
That’s where the case for the low being in starts to build.
If price moves into this zone and gets rejected again, then nothing has really changed. It simply reinforces this area as resistance and keeps the prevailing trend intact.
If the Structure Breaks Lower
If the triangle resolves to the downside, the measured move points toward the mid-$70Ks, roughly $75,000.
This level stands out mainly because it marks a prior low and sits near a psychological round number. When price moves into thinly traded zones like this, reactions tend to be sharper, with moves often stalling, bouncing, or consolidating as liquidity gets tested.
That doesn’t mean $75K has to be the bottom. It just means it’s a level where some form of response becomes more likely if price gets there.
Putting It All Together
Bitcoin is still coiled inside this symmetrical triangle, and it formed after a strong move down.
If price breaks higher and holds above $103K to $105K, the upside case improves and the low may already be in. If it gets rejected there, that zone remains a ceiling.
If the structure breaks lower, $75K lines up with the triangle’s measured move and prior structural support. That’s where reactions become more probable.
There are also projections calling for much deeper downside, even toward $50K. For now, though, these are the zones that matter structurally.
Once Bitcoin breaks out of this triangle, the move toward one of these areas becomes much more likely. This isn’t about predicting the outcome. It’s about understanding why these levels matter when price gets there.


