
- Weekly Outlook
- August 23, 2024
- 7 min read
Monetary Manoeuvres: What This Week’s Economic Data Could Mean for U.S. and Eurozone Rate Cuts
As we move into the upcoming week, both the United States and Eurozone are set to release crucial economic data that will likely influence monetary policy decisions in the near term. With interest rate cuts and inflation targets dominating the discourse, market participants will be closely analysing this data to gauge the future direction of central bank actions.
U.S. Economic Outlook: Focus on Inflation and Employment Data
US Fed Rate and EUR/USD Correlation
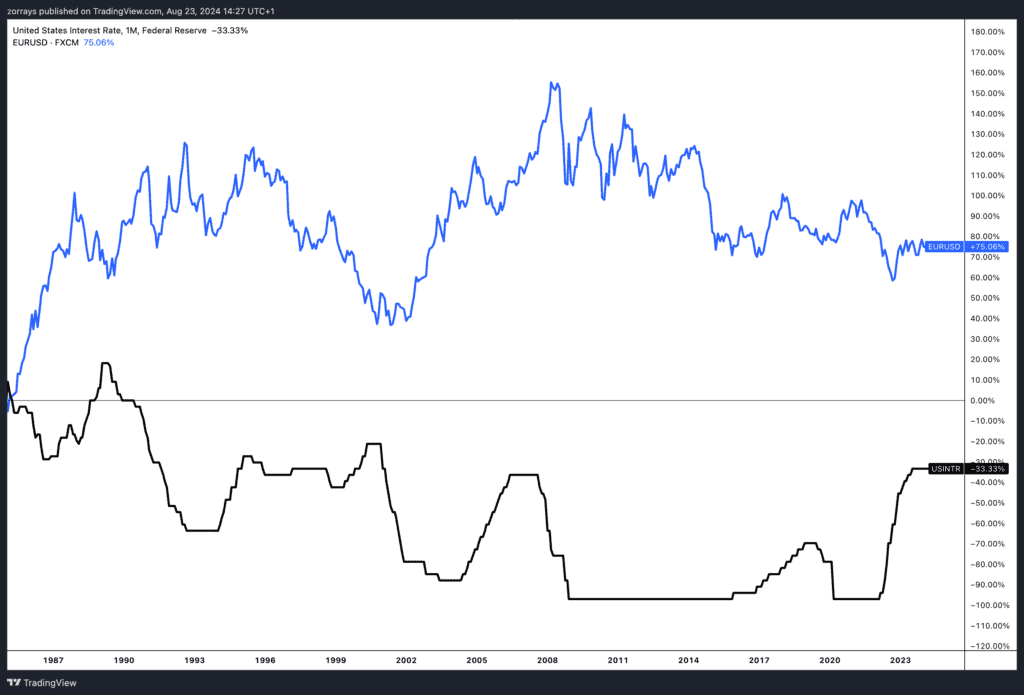
Recent developments in the U.S. have pointed towards a potential easing of monetary policy. The Federal Reserve’s July Federal Open Market Committee (FOMC) minutes revealed that the majority of members are leaning towards an interest rate cut in September. This sentiment was further bolstered by recent downward revisions to nonfarm payrolls, which highlight a potential softening in the labor market.
Anticipation of Rate Cuts:
Alchemy Market’s U.S. Interest Rates Forecast
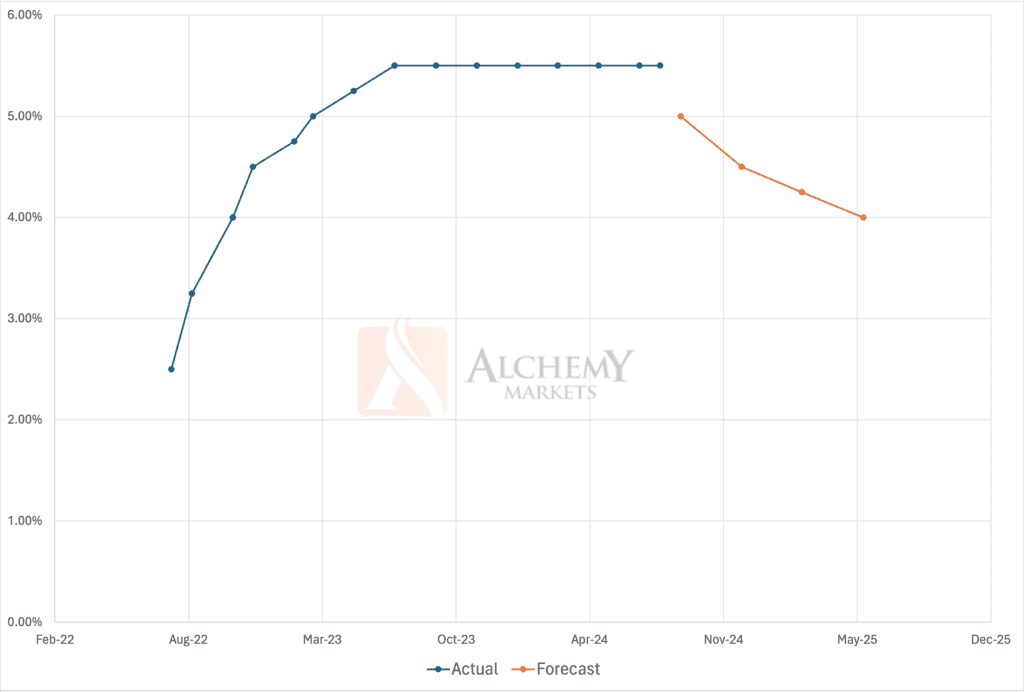
Source: Federal Reserve
Market expectations have solidified around the likelihood of a rate cut, with a 25 basis points (bp) reduction being the most probable outcome. However, there is speculation that a more substantial 50bp cut could be on the table, especially if the upcoming jobs report, scheduled for release on September 6th, shows significant weakness. As it stands, the market is pricing in approximately 100bp of rate cuts by the end of the year, reflecting concerns about economic growth and inflation dynamics.
Key Event: Core Personal Consumption Expenditure (PCE) Deflator
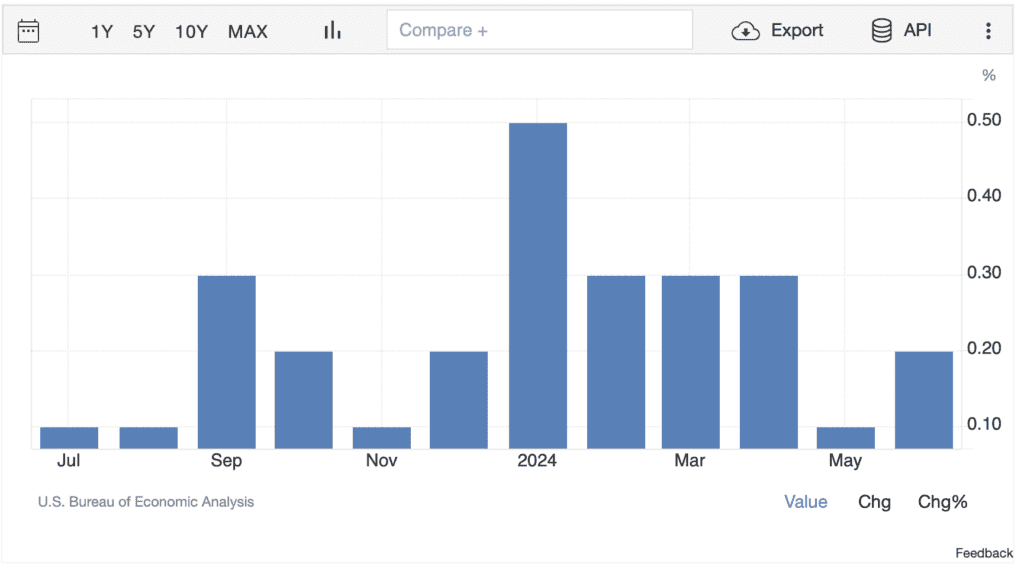
Source: Trading Economics
In the week ahead, the spotlight will be on the Fed’s preferred inflation gauge, the core Personal Consumption Expenditure (PCE) deflator. This metric is critical as it provides insight into underlying inflation trends, excluding the more volatile components like food and energy. Given the recent Producer Price Index (PPI) and Consumer Price Index (CPI) readings, we anticipate a modest 0.2% increase in the core PCE deflator. This figure aligns with the Fed’s 2% inflation target on an annualized basis, supporting the case for a cautious approach to rate cuts.
Eurozone Economic Outlook: Inflation and Unemployment in Focus
Across the Atlantic, the Eurozone is also preparing for significant data releases, which could influence the European Central Bank’s (ECB) policy stance at its upcoming meeting.
Inflation Data:
On Friday, the flash inflation data for August will be released. While core inflation is expected to remain stable, the headline inflation rate is likely to edge lower, primarily due to declining petrol prices. This decrease, however, is not anticipated to have a major impact on the ECB’s decision-making process. With inflationary pressures remaining subdued, a 25bp rate cut is still the most likely scenario for the ECB’s September meeting.
Unemployment Rate:
Also on the agenda is the unemployment rate for July, which will be closely watched following a slight uptick in June from 6.4% to 6.5%. While this increase may signal a mild cooling in the labor market, it is not expected to cause significant concern, as the unemployment rate remains near historic lows. Nonetheless, any further rise could reinforce the case for accommodative monetary policy to support economic activity.
Technical Analysis:
EUR/GBP Technical Analysis: Bull Flag Formation
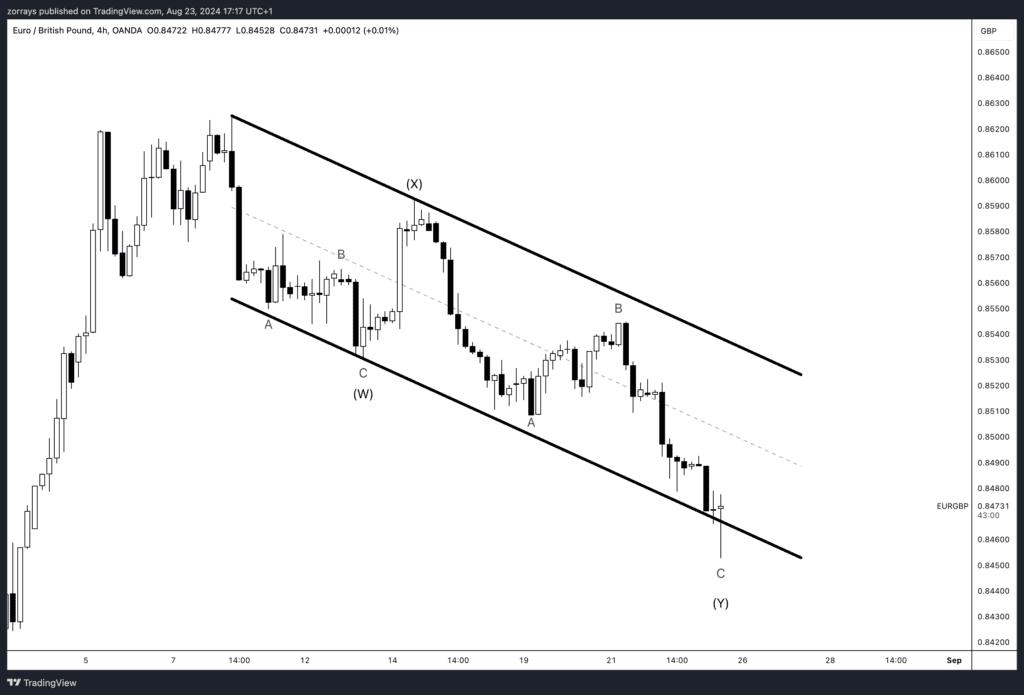
Source: Trading View
The EUR/GBP pair has recently been navigating a complex correction characterised by a double zig zag pattern, commonly referred to as a bull flag. This technical formation typically signals a continuation of the prevailing trend following a period of consolidation, suggesting potential upward momentum for the pair.
This technical pattern, combined with the fundamental backdrop of cautious monetary policy and growth differentials, suggests that EUR/GBP may experience renewed upward momentum. Traders and analysts should monitor the pair for confirmation of the breakout towards the projected levels, as the double zig zag (bull flag) formation sets the stage for a potential continuation of the bullish trend.
In summary, the EUR/GBP pair’s formation of a complex correction double zig zag (bull flag) pattern, alongside the Bank of England’s cautious stance and prevailing growth differentials, points towards a potential upward correction.
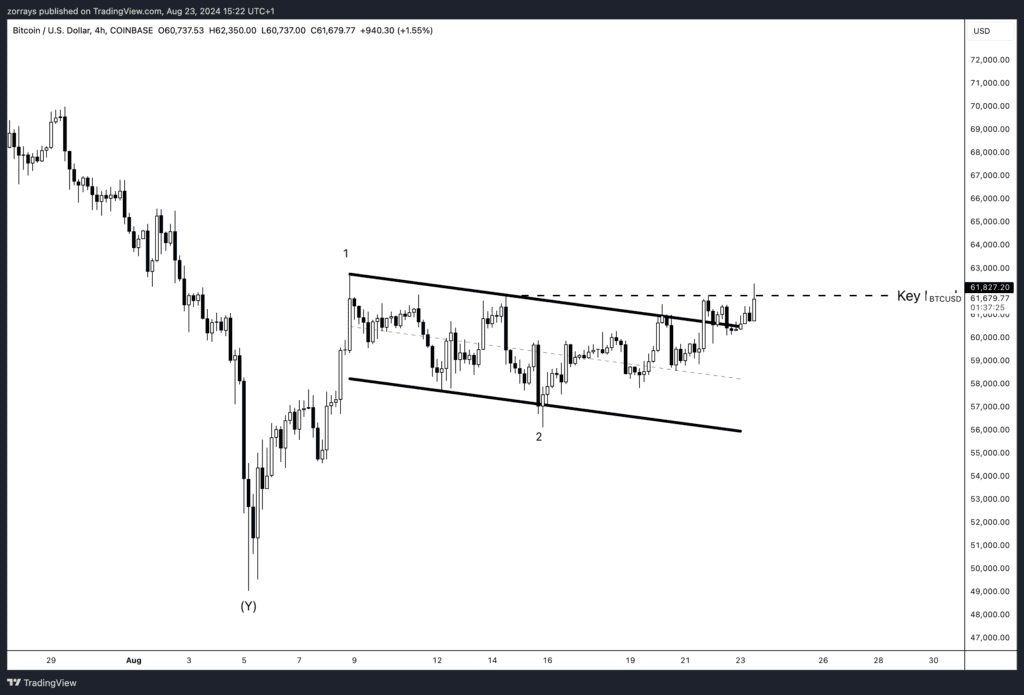
Bitcoin (BTC/USD) Technical Analysis: Potential Bullish Breakout Amid Choppy Correction
Source: Trading View
Bitcoin is currently navigating a zig-zag correction, often referred to as a bull flag, which suggests the potential for further upside. The cryptocurrency has recently breached the key level at $61,827.20, indicating a possible bullish continuation. However, the price action within this formation lacks the typical impulsiveness of a wave 3 rally, characterized by strong, decisive moves. Instead, the movement has been choppy and sloppy, raising the possibility that Bitcoin might be setting up for a more complex correction before any significant breakout.
Despite the current price action, the break above the key level still leaves the door open for bullish scenarios. If Bitcoin manages to gather momentum and break out of this correction phase, we could see a strong push higher, confirming the bull flag pattern. Traders should watch for further confirmation in the price structure before committing to an extended bullish position.
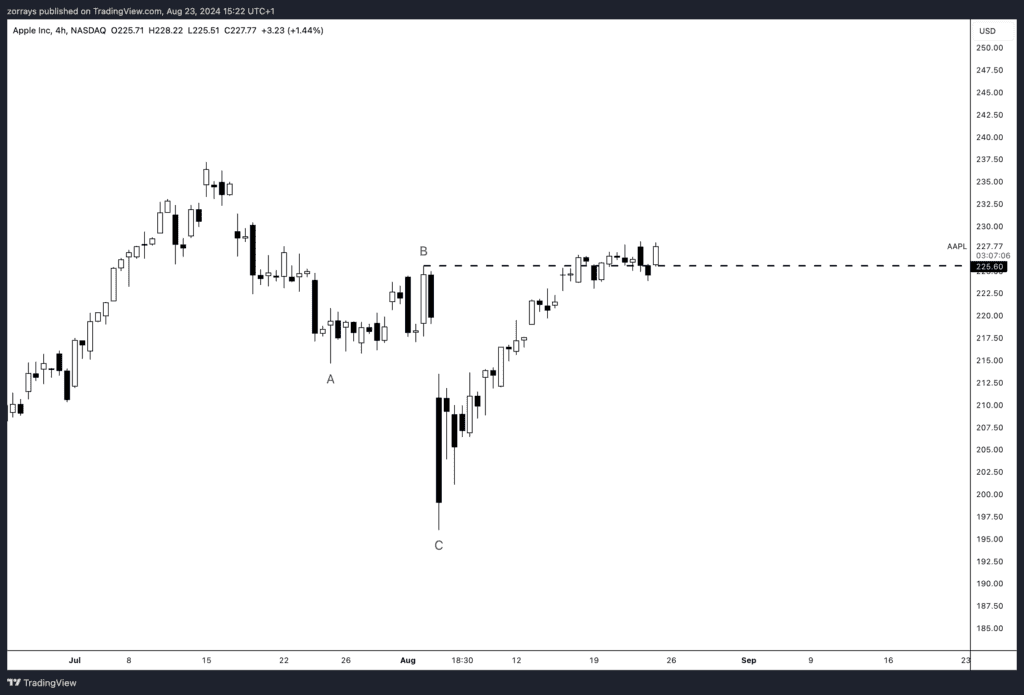
Apple (AAPL) Technical Analysis: Bullish Continuation in Play After Key Breakout
Source: Trading View
Apple Inc. (AAPL), often seen as a bellwether for the broader stock market, has shown renewed bullish momentum following the confirmation from the Fed at the Jackson Hole event that a rate cut is on the horizon. This dovish stance has provided the market with additional confidence, fueling a risk-on environment that is particularly beneficial for growth stocks like Apple.
Technically, AAPL has broken through a significant level at $225, which forms part of a larger zig-zag pattern, suggesting that the stock could be set for another upward leg. The breakout signals a potential continuation of the bullish trend, with the stock likely to test higher levels in the coming weeks as investor sentiment remains positive. As the Fed’s loose monetary stance continues to support equities, AAPL is poised to benefit, possibly leading the charge in a broader market rally.
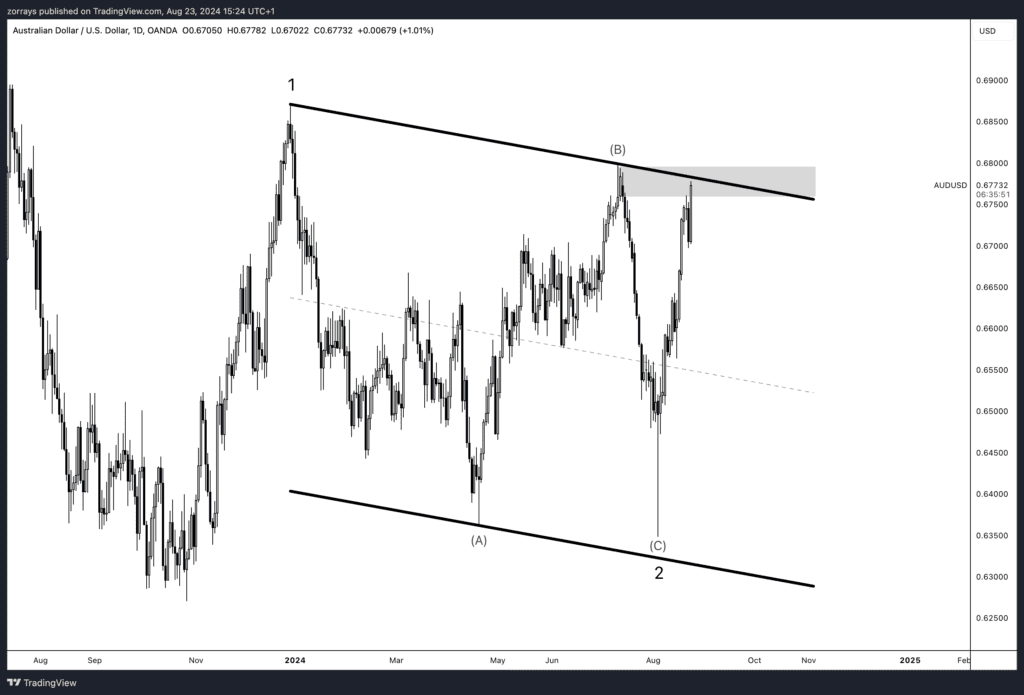
AUD/USD Technical Analysis: Approaching Key Resistance Amid Hawkish RBA Stance
Source: Trading View
The AUD/USD pair is approaching a critical resistance zone, coinciding with the upper boundary of a descending channel that it has been trading within. This resistance area also marks a key level, and a break above it could signal a significant bullish breakout. Technically, the pair appears to be forming a 5-wave sequence to the upside, indicating a potential continuation of the current bullish trend.
Fundamentally, the Reserve Bank of Australia (RBA) remains hawkish as it struggles to control persistent inflationary pressures, which contrasts sharply with the dovish tone from the Fed. This divergence in monetary policy outlooks positions the AUD/USD as an attractive carry trade, with the Australian dollar likely to appreciate further against the U.S. dollar. Additionally, the current risk-on sentiment in the market supports higher-yielding currencies like the Australian dollar, further enhancing the bullish outlook for AUD/USD. Traders should watch for a break of the key resistance level, which could open the door for a sustained move higher.
Conclusion: Preparing for Market Reactions
The coming week is set to provide critical data points that will shape market expectations and central bank actions in both the U.S. and Eurozone. Investors and analysts alike will be monitoring these developments closely, particularly the U.S. core PCE deflator and Eurozone inflation figures, as they provide crucial insights into the economic health and future policy direction. As always, unexpected results could lead to volatility in financial markets, making it a pivotal week for traders and economists alike.


