Written by:

- Weekly Outlook
- August 2, 2025
- 4 min read
Economic Slowdown Signs, Sticky Inflation & Major Moves in DXY, SPX & Gold
Wrapping Up This Week: Lagging GDP vs. Leading Weakness
This week delivered a complex mix of economic signals for investors to digest. On the surface, Q2 U.S. GDP came in hot—growing at 3.0% annualised, well above estimates. But a closer look reveals that much of the strength came from falling imports and inventory adjustments—backward-looking components, not consumer-driven momentum.
In contrast, leading indicators tell a different story:
- ISM Manufacturing both came in weaker than expected, pointing to slowing activity ahead.
- University of Michigan’s Consumer Sentiment dropped again, reflecting rising anxiety about inflation and job stability.
- Forward inflation expectations also ticked higher to 4.5%—raising fresh concerns over future purchasing power.
This divergence suggests that while the present economy looks resilient, future GDP and corporate earnings could face significant headwinds.
Fed Watch: A Hawkish Hold But Cracks Appear
The Federal Reserve left interest rates unchanged, holding steady between 4.25%–4.50%. Chair Powell reaffirmed a data-dependent path, emphasizing the Fed remains vigilant on inflation. However, two key officials—Michelle Bowman and Christopher Waller—dissented, voting in favor of an immediate rate cut.
Their reasoning? A softening labor market. This week’s disappointing jobs data fueled speculation that the Fed may not have the luxury of time to maintain a hawkish stance if the job market deteriorates further.
Powell’s refusal to commit to a September cut leaves markets in limbo, especially with two key CPI reports still due before the next FOMC meeting.
Inflation: The Tariff Lag Is Hitting Hard
For months, economists warned that U.S. tariffs on imports would stoke inflation—but with a delay. Now, the data backs it up.
This week’s core PCE deflator—the Fed’s preferred inflation gauge—rose to 2.8% year-over-year. More alarmingly, goods inflation over the past 3 months annualized is approaching 4%, and that may not be the ceiling.
What’s driving this?
- Tariffs are beginning to show up in consumer prices, especially for imported goods and food.
- Retailers and suppliers are finally passing cost burdens onto consumers after months of margin compression.
This may force the Fed into an uncomfortable bind: cutting rates into rising inflation. Unless future CPI prints surprise lower, the Fed may be forced to hold—or risk undermining its credibility.
Next Week’s Economic Calendar: What to Watch
U.S. Data
- ISM Services Index (Tuesday): A key gauge for consumer and corporate demand. Regional data suggests a modest rebound, but another miss could dampen sentiment further.
- Trade Balance (Wednesday): With a narrower goods deficit already logged, we may see improvement in the overall U.S. trade position—a potential upside for GDP revisions.
- Fed Speak: Watch closely for speeches from regional Fed presidents. Hawkish or dovish tones may shift expectations as we head into September.
Bank of England (Thursday Decision)
- The UK labor market is weakening, and inflation is showing signs of cooling—but only marginally.
- We expect a 25 basis point rate cut, but the vote could be split 3 ways, revealing a deeply divided Monetary Policy Committee. A dovish tone could weigh on the pound.
Technical Market Breakdown
U.S. Dollar Index (DXY)
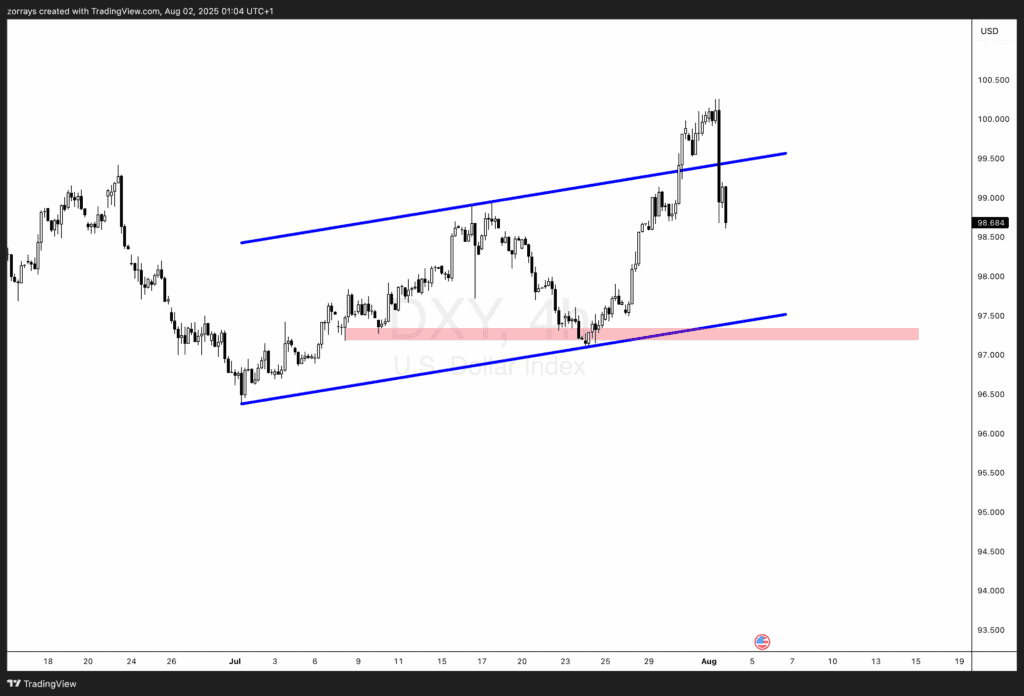
This week’s soft ISM data pushed the dollar back inside its ascending channel. The price broke below the upper boundary and may now aim for the 97.00 support level, aligning with the bottom of the channel and a key demand zone.
Key level to watch: 97.00
Bias: Bearish short-term, contingent on upcoming ISM and CPI prints
S&P 500 Index (SPX)
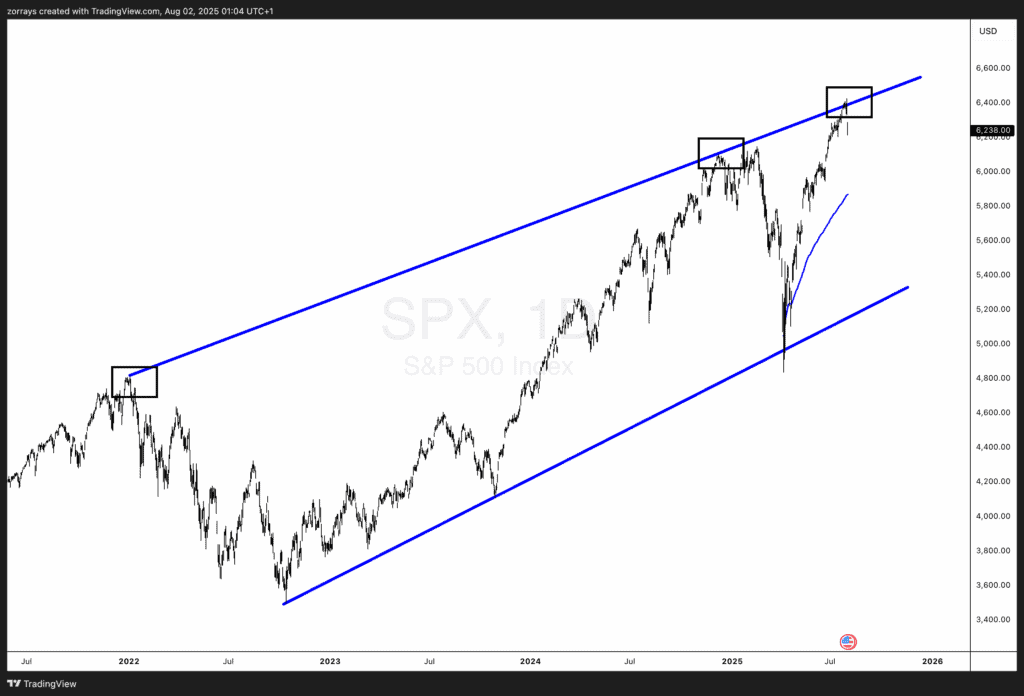
The S&P 500 continues to respect the upper boundary of its long-term rising wedge. Price was rejected from the top this week, suggesting a potential short-term pullback or consolidation phase.
Technical outlook: Caution warranted at current levels
Key level: 6,200 support / 6,400 resistance
Gold (XAU/USD)
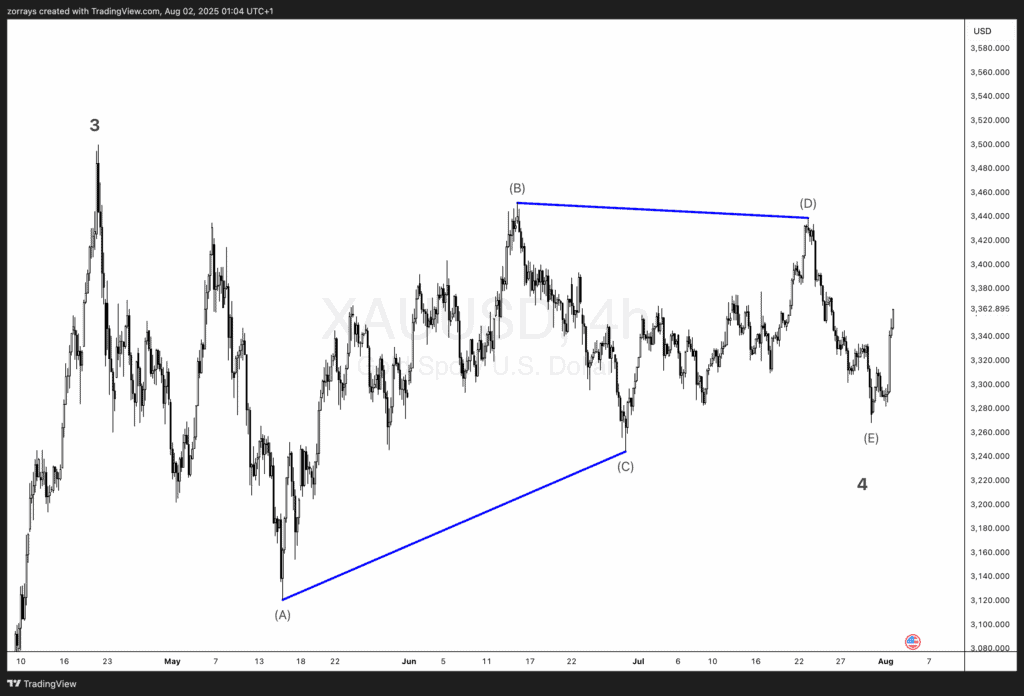
The gold chart remains somewhat subjective depending on wave degree interpretation, but current structure aligns well with a completed Wave 4 triangle. This may imply the start of Wave 5 to the upside, especially if inflation hedge demand returns.
Narrative support: Market front-running Fed dovishness
Technical bias: Bullish if $3,240 zone holds
Conclusion: A Market Preparing for Pivot?
We are witnessing the beginning of a potential economic deceleration phase. While lagging indicators like GDP still show resilience, leading data—including ISM, consumer sentiment, and inflation expectations—suggest cloudier skies ahead.
The Fed remains on edge, caught between inflation stickiness and labor softness. A clear policy pivot is not yet confirmed, but markets may already be front-running a dovish shift—especially with gold regaining its role as a hedge.
Next week’s ISM services, trade balance, and BoE rate decision will be critical in shaping the narrative heading into August’s final stretch.
Stay nimble, stay informed.