


Written by:


- Weekly Outlook
- August 16, 2024
- 6 min read
Central Bank Chess: The Fed’s Next Move and Eurozone’s Economic Jitters
Key Takeaways
- Jackson Hole Symposium: The Federal Reserve may signal that monetary policy is overly restrictive, with a focus on easing interest rates due to improving inflation and a cooling job market.
- US Housing Data: Upcoming reports on existing and new home sales may influence expectations for the Fed’s September meeting, with the potential for a 25bp interest rate cut.
- Eurozone Economic Indicators: Weak PMI data and wage reports could reinforce the likelihood of a September rate cut by the ECB.
- Middle East Tensions: Geopolitical risks are present but have had limited impact on global markets, with a focus on US economic data and Fed policy instead.
- Technical Charts: EUR/USD, U.S. Oil and Bitcoin
United States (USD)
Jackson Hole Symposium (Thu):
The Jackson Hole Symposium is anticipated to serve as a stage for the Federal Reserve to indicate that current monetary policy may be too restrictive. With inflation showing signs of easing, the Fed can now afford to place more emphasis on the job market, which has been cooling at a noticeable pace. Following the recent market turbulence, financial markets are leaning towards the Fed enacting a 25 basis point interest rate cut on September 18. This expectation is bolstered by stronger-than-expected retail sales figures and resilience in jobless claims data. However, significant upcoming events and data releases could still sway the Fed towards a larger 50 basis point cut, although this is less likely.
Housing Market Data:
- Existing Home Sales (Thursday): The market is anticipating figures consistent with last month’s 3.89 million.
- New Home Sales (Friday): A slight increase is expected, with forecasts predicting 630,000 new home sales, up from the previous 617,000.
These housing data points could further influence the Fed’s decision. If the data comes in stronger than expected, it may temper expectations for a rate cut, potentially strengthening the USD. However, weaker-than-expected data could bolster the case for a cut, potentially pushing EUR/USD higher as the Fed adopts a more dovish stance.
Euro (EUR)
Purchasing Managers’ Index (Thu):
The eurozone’s PMI figures this Thursday are set to be closely scrutinised, especially given recent signs of economic fragility. While the first half of the year saw a return to positive GDP growth, recent surveys have raised concerns about the sustainability of this recovery. A weaker-than-expected PMI reading could confirm a slowdown, which would likely increase the odds of a rate cut by the European Central Bank (ECB) in September.
Wages (Tue):
On Tuesday, the ECB will release the latest negotiated wage data for the eurozone. This data is critical for the ECB’s September rate cut decision. The first quarter saw an unexpected rise in wages, contrary to the ECB’s hopes for a decline. With labour unions still pushing to recover lost purchasing power, a significant drop from the current high of 4.7% is unlikely in the second half of the year. Persistently high wage growth could complicate the ECB’s efforts to ease policy, potentially limiting the scope for a September rate cut.
EURO
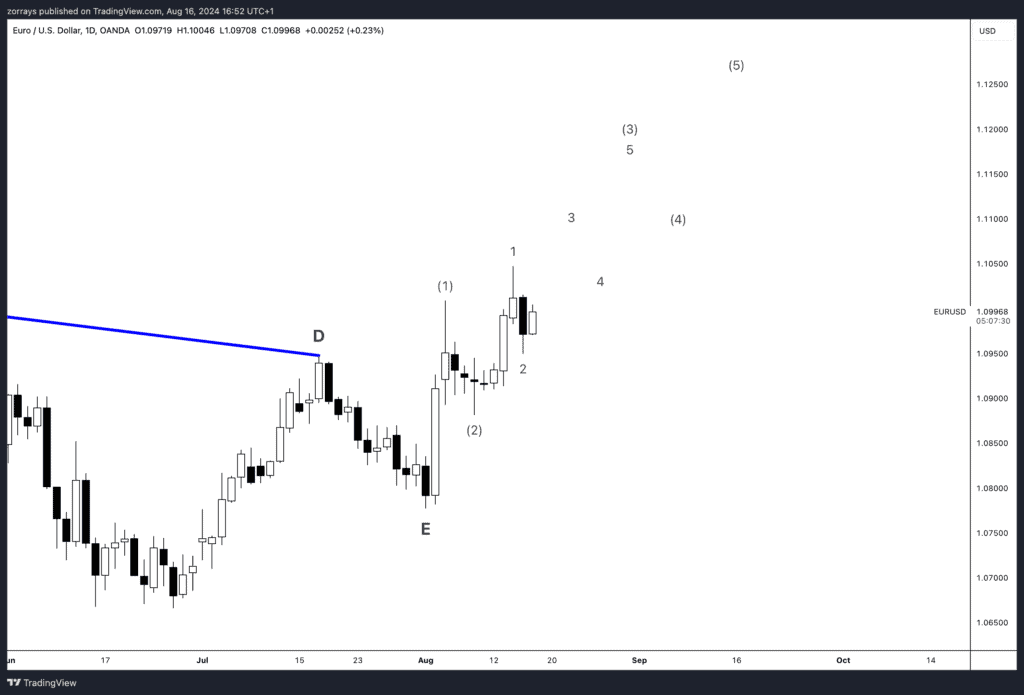
The EUR/USD pair is currently navigating a complex Elliott Wave structure, with the recent price action suggesting the completion of a 1-2-1-2 pattern. This indicates the potential for a bullish impulse wave, where the next upward movements could align with a third wave extension.
In the first chart, the pair has successfully broken out of the triangle formation that completed with the D-E leg. Following this breakout, the price action confirms the wave count of 1-2, which lays the groundwork for a potential continuation higher towards the third wave (3) target zone around 1.1150 – 1.1250.
EURO Alt Count
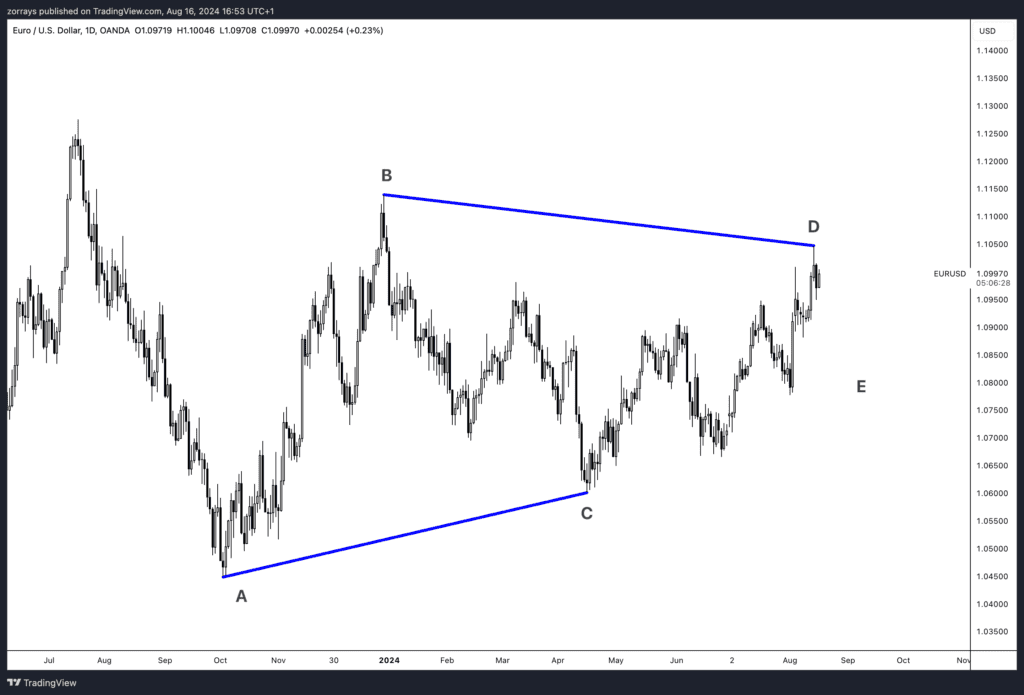
However, the alternative count suggests that the triangle formation is still in progress. As shown in the second chart, the broader A-B-C-D-E triangle pattern could still be unfolding, with the E-leg possibly completing soon. If this scenario plays out, the pair may face a retracement or consolidation before a definitive breakout occurs.
In either case, the technical setup favours further bullish momentum, but traders should be cautious of possible short-term pullbacks or consolidations as the pattern finalises. A break above the 1.1050 level would likely validate the bullish continuation, while a failure to sustain these levels might see the pair retest lower support zones.
Middle East Tensions and Market Reactions
As tensions in the Middle East escalate, there’s been some market reaction, particularly in regional assets like the USD/ILS exchange rate, which has experienced fluctuations. However, the impact on global commodities, especially oil, has been surprisingly muted. Despite the potential for geopolitical strife to disrupt global growth through oil price spikes, the oil market has largely focused on demand factors driven by slowdowns in the US and China, as well as the potential impact of the US elections on oil supply. While a further escalation could lead to higher oil prices if key infrastructure is threatened, for now, global markets remain more concerned with economic data and central bank policies. The broader takeaway is that while geopolitical events can have significant effects on specific sectors or regions, their global impact tends to hinge on direct consequences for growth, inflation, or economic policy.
U.S. Oil

In analysing the WTI Crude Oil chart, I’ve initially identified this pattern as a potential triangle formation. While I still believe that this is likely some form of a triangle, there are multiple possibilities regarding whether the triangle has already completed or if it’s still unfolding.
Given the uncertainty surrounding the triangle’s status, it’s prudent to focus on the key support and resistance levels that have been established. The current resistance sits at around $84.74, while the support level is at $72.24. These levels are critical for gauging the next directional move in oil prices.
Until there is more clarity on the triangle pattern, trading within this range could provide opportunities. A breakout above resistance would likely signal further bullish momentum, whereas a breakdown below support could indicate a bearish shift. For now, keeping a close eye on these levels is essential for navigating the oil market’s near-term direction.
Bitcoin Technical Analysis
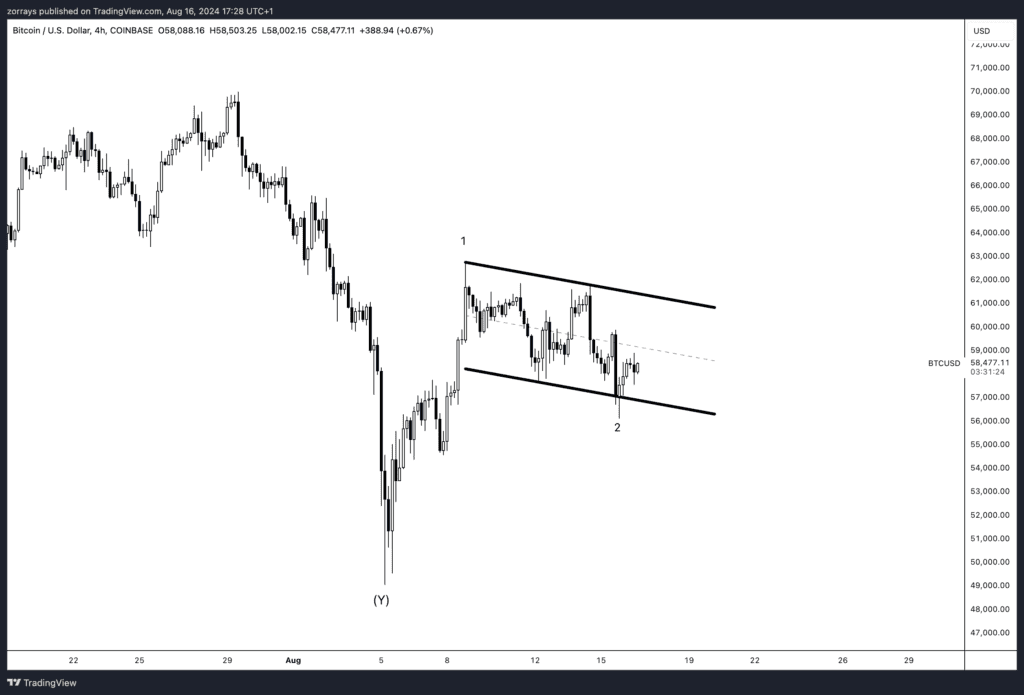
In previous discussions, I’ve highlighted the broader picture for Bitcoin, where the price action has been unfolding within a large, complex correction that resembles a bull flag pattern. This longer-term structure suggested a potential bullish continuation once the correction completed.
Now, zooming in to a lower degree, we can observe that Bitcoin is forming another smaller zigzag pattern, which also takes the shape of a bull flag. This pattern is often indicative of a continuation move higher after the corrective phase.
As the chart shows, Bitcoin is currently trading within this flag, and a breakout above the upper boundary could signal the resumption of the uptrend, potentially leading to significant gains. However, if Bitcoin fails to hold above the support area outlined by the lower boundary of the flag, this would call for a reevaluation of the bullish scenario. A breakdown below support could indicate a deeper corrective move, potentially delaying the anticipated upward momentum.
For now, the key is to monitor how Bitcoin behaves around these levels, as the next move could provide clearer direction for the near-term outlook.


