


Written by:


- Opening Bell
- March 3, 2025
- 4 min read
Major BOUNCE on Crypto: Trump Announces US Crypto Reserve Over the Weekends
Trump announced a US Crypto reserve on Sunday, March 2nd, spiking the price of crypto across the board. The strategic reserve is revealed, and considers holding Bitcoin, Ethereum, XRP, Solana and Cardano, with the purpose of making the U.S. the “Crypto Capital of the World”.
Immediately after this announcement, all mentioned cryptos experienced a price surge. Bitcoin Futures Open Interest shot up significantly, which suggests this market move has institutional volume; making it different from most weekend moves.
| Asset | Price Change (March 2nd) | Open Interest Change (24H) |
|---|---|---|
| Bitcoin | +9.53% | +7.00% |
| Ethereum | +13.56% | +5.63% |
| XRP | +34.13% | +38.15% |
| Solana | +24.40% | +15.04% |
| Cardano | +72.15% | +110.61% |
Bitcoin Bounces from Fair Value Gap, 50% Fib, and Anchored vWAP
As per our last analysis, the Bitcoin price did find a home at the Fair Value Gap between $81,395–$85,160, and bounced almost exactly at the 50% Fibonacci level of $79,294.
Adding to the confluence, but initially missed, is an anchored vWAP calculated from the pivot low of the rally. As you can see, it aligns perfectly with the fair value gap, and is only a little above the 50% Fib Level—creating a cluster of supports.
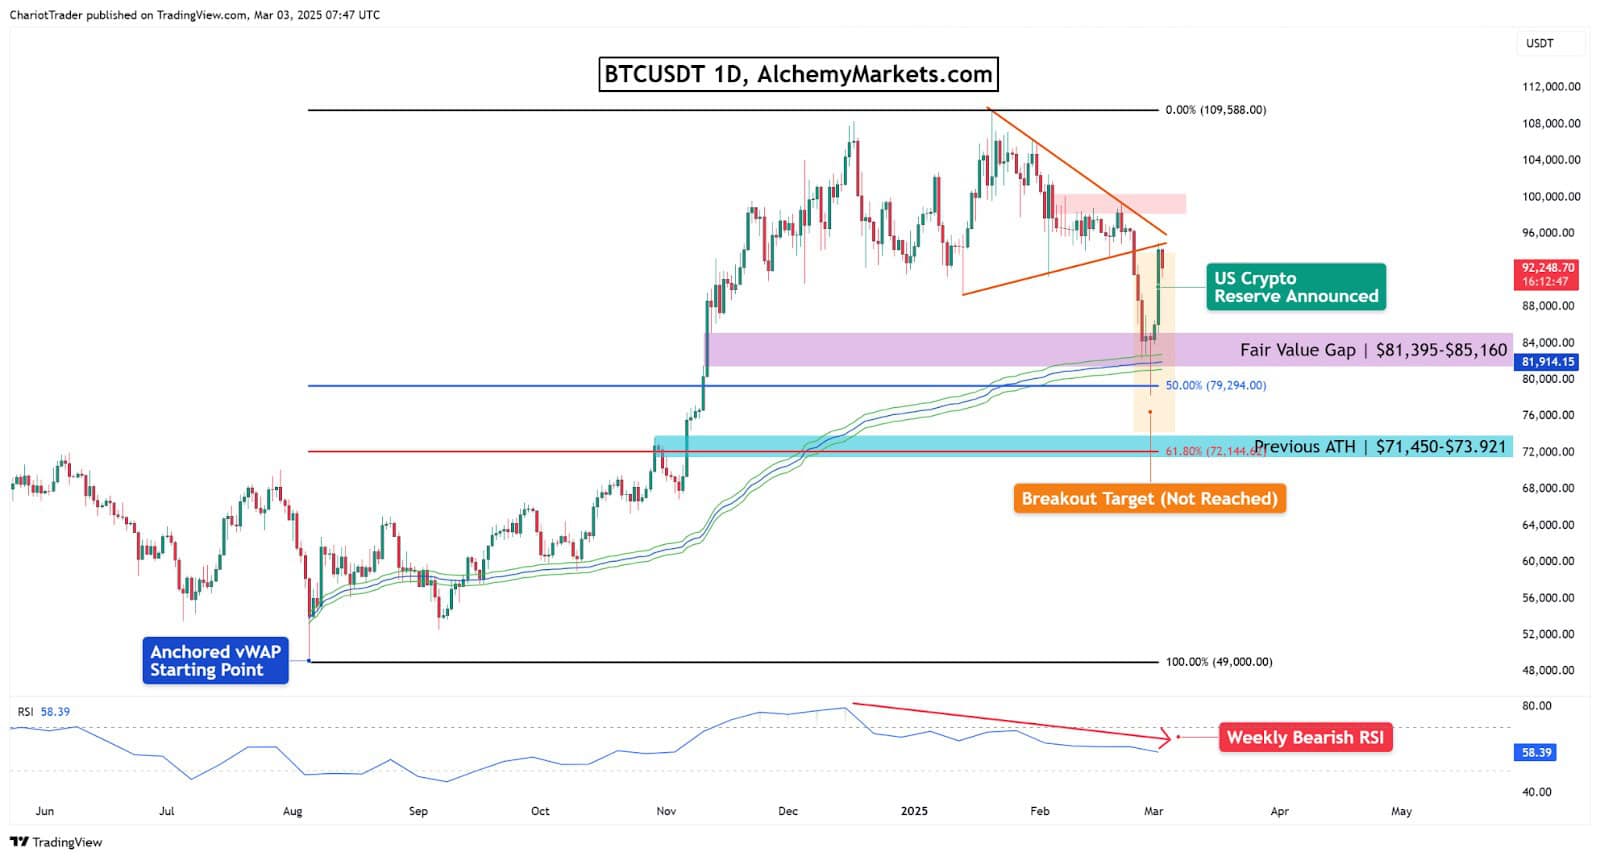
Is the Bitcoin low in?
Given such a strong bounce at this cluster of support levels, along with strong fundamentals, the low could be in.
However, it would be foolish to ignorant bearish signs, such as a weekly bearish RSI divergence. If we do go lower, we have bearish targets of the Symmetrical Triangle at approximately $74,000. The aligns closely with previous all-time high price are, at around 71,450–$73,921. Currently, Bitcoin is getting rejected at the lower trendline, which lies around $94,750.
If we can reclaim several resistances above, and hold them as support, then it is likely the Bitcoin bottom is in.
Is this weekend price action significant?
While most weekend moves tend to be fake-outs, this movement came with significant volume and an open interest increase of 7.00%. Combined with the bullish fundamentals, I’d personally consider this weekend move to be significant.
Bitcoin Monthly Close vs Weekly Close
We have an interesting circumstance on Bitcoin right now: the monthly candle closed below the yearly open of $93,530, yet our weekly candle closed above.
- The monthly candle is a bearish marubozu that closed below the yearly open.
- The weekly candle is a bullish hammer that closed above the yearly open.
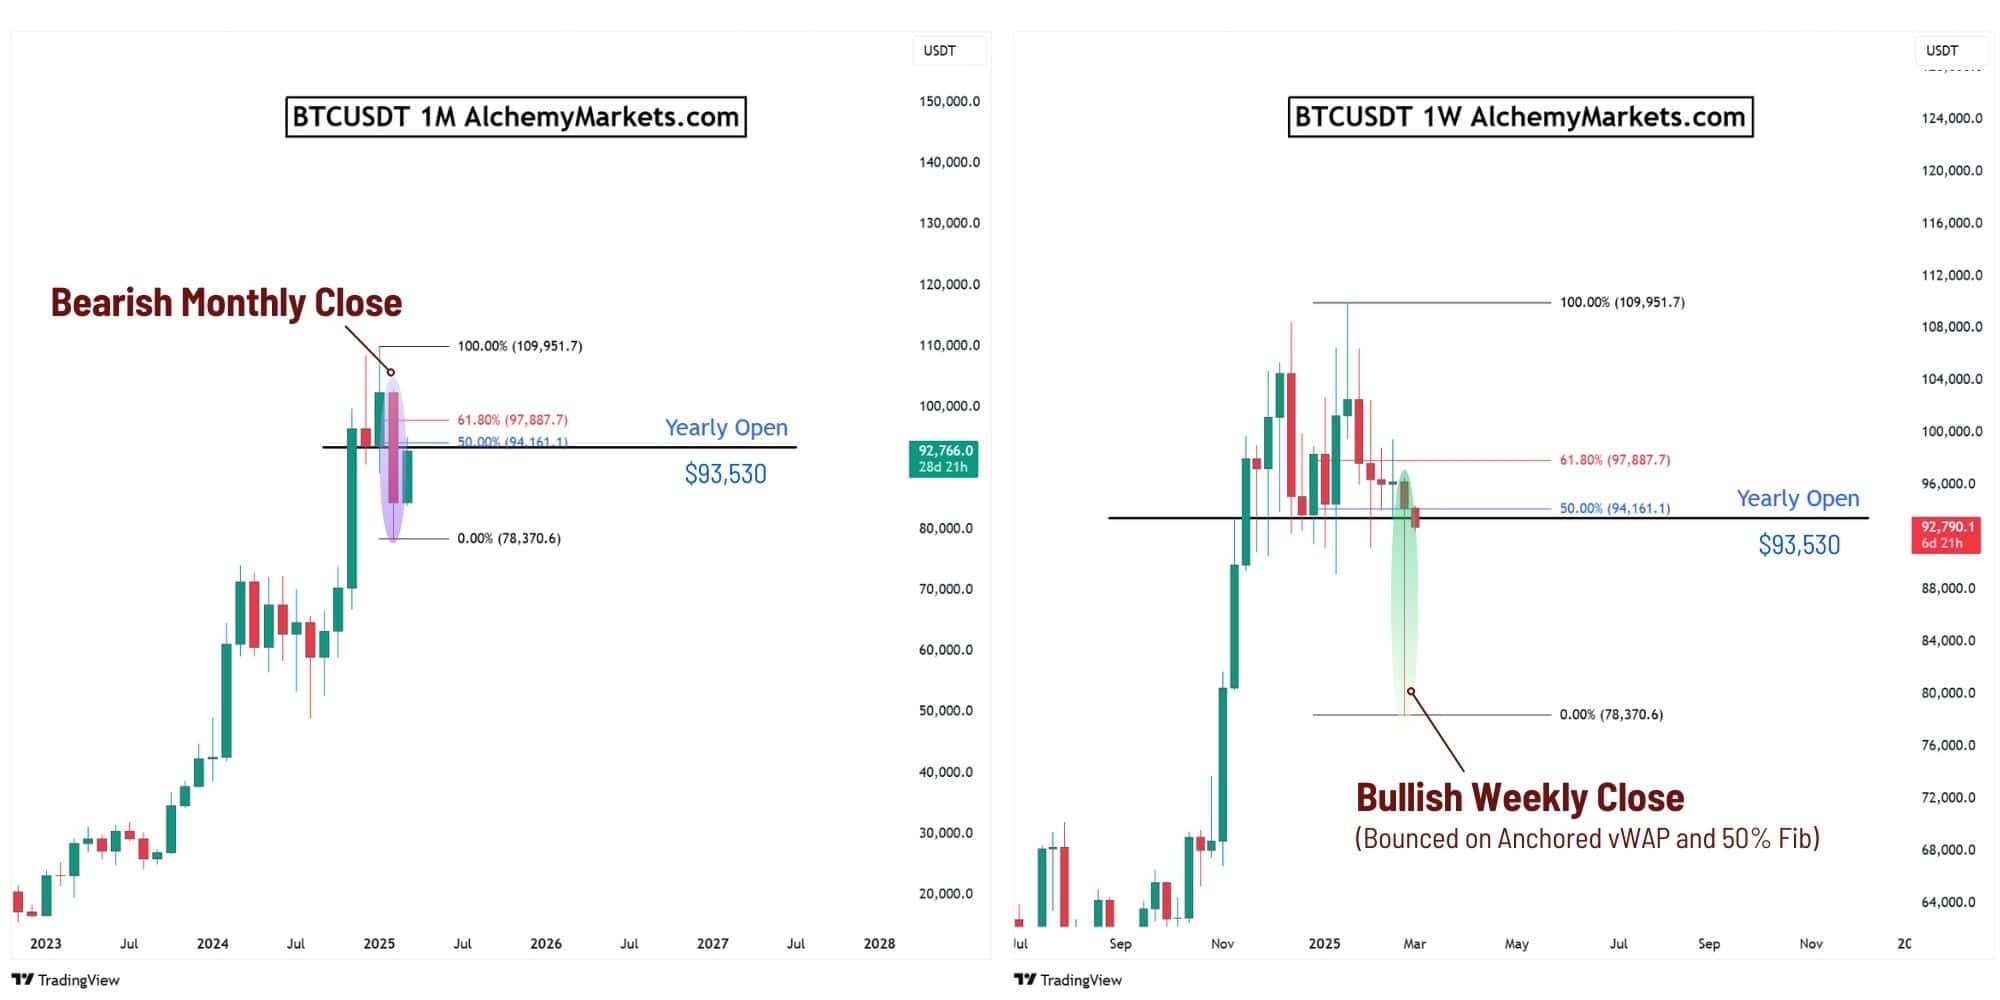
Bullish scenario:
Bitcoin closes above 61.80% of the bearish Fibonacci retracement ($97,887), and hold above the year open.
Bearish scenario:
Bitcoin descends some more, then retraces to be rejected at the yearly open ($93,530), 50% Fib ($94,161), or 61.80% Fib ($97,887).
Quick Hit Analysis: ETH, XRP, SOL, ADA
Ethereum (ETH) 1W Chart
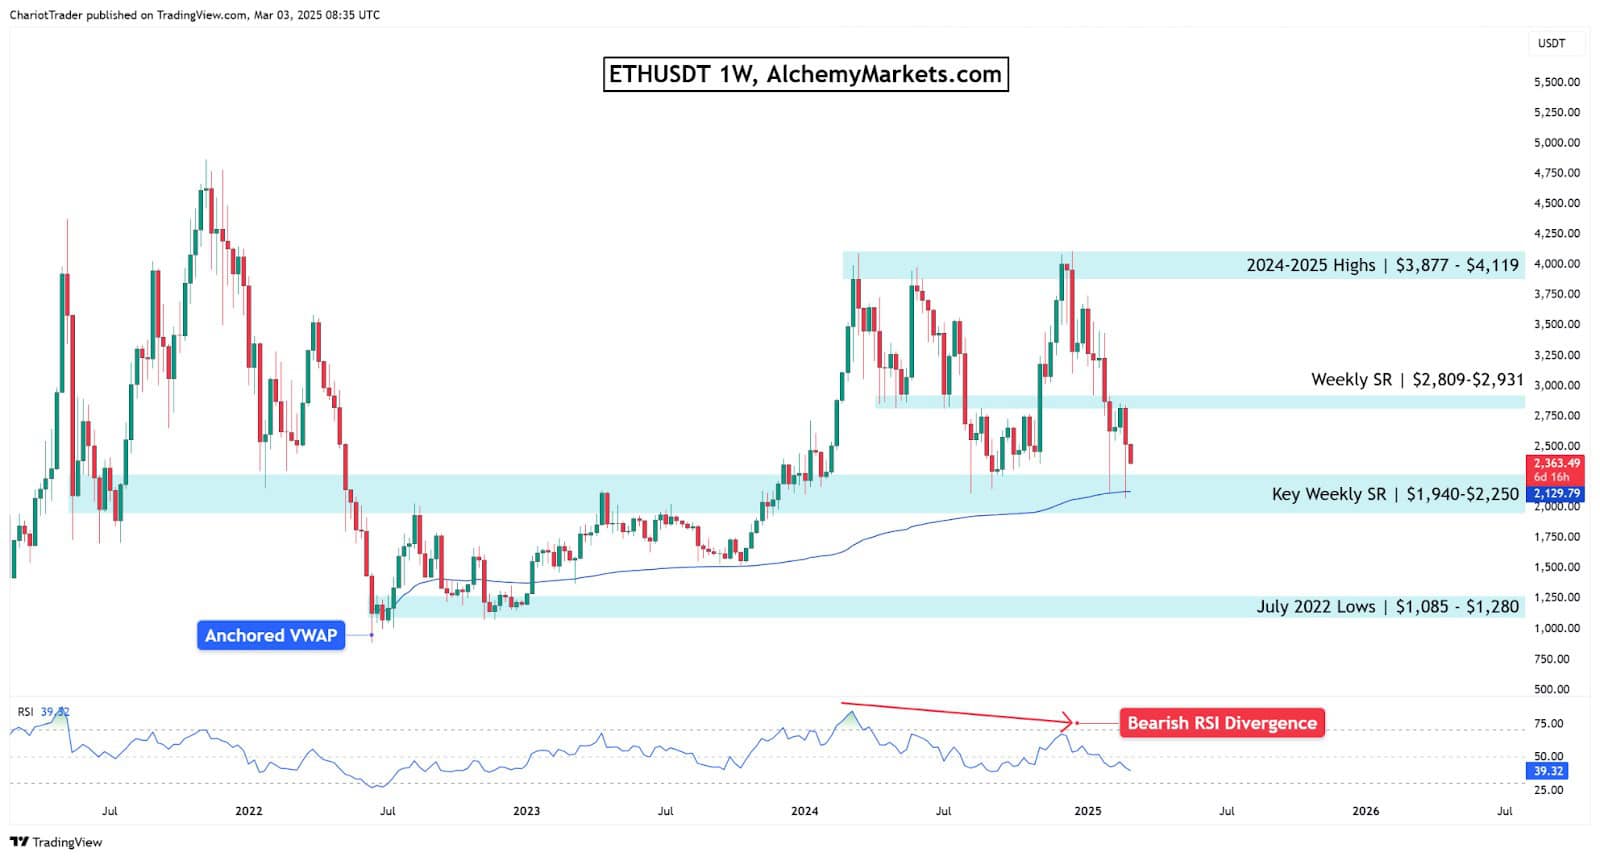
ETH bounced on the anchored vWAP just like Bitcoin, and is currently range-bound between $2,000 to $4,000.
Bullish scenario: Hold above the key weekly SR level at $1,940, or break the weekly SR zone at $2,809.
Bearish scenario: Break of the key weekly SR level at $1,940.
Daily RSI: Hit oversold status on March 1st, suggesting bearish exhaustion.
Ripple (XRP) 1W Chart
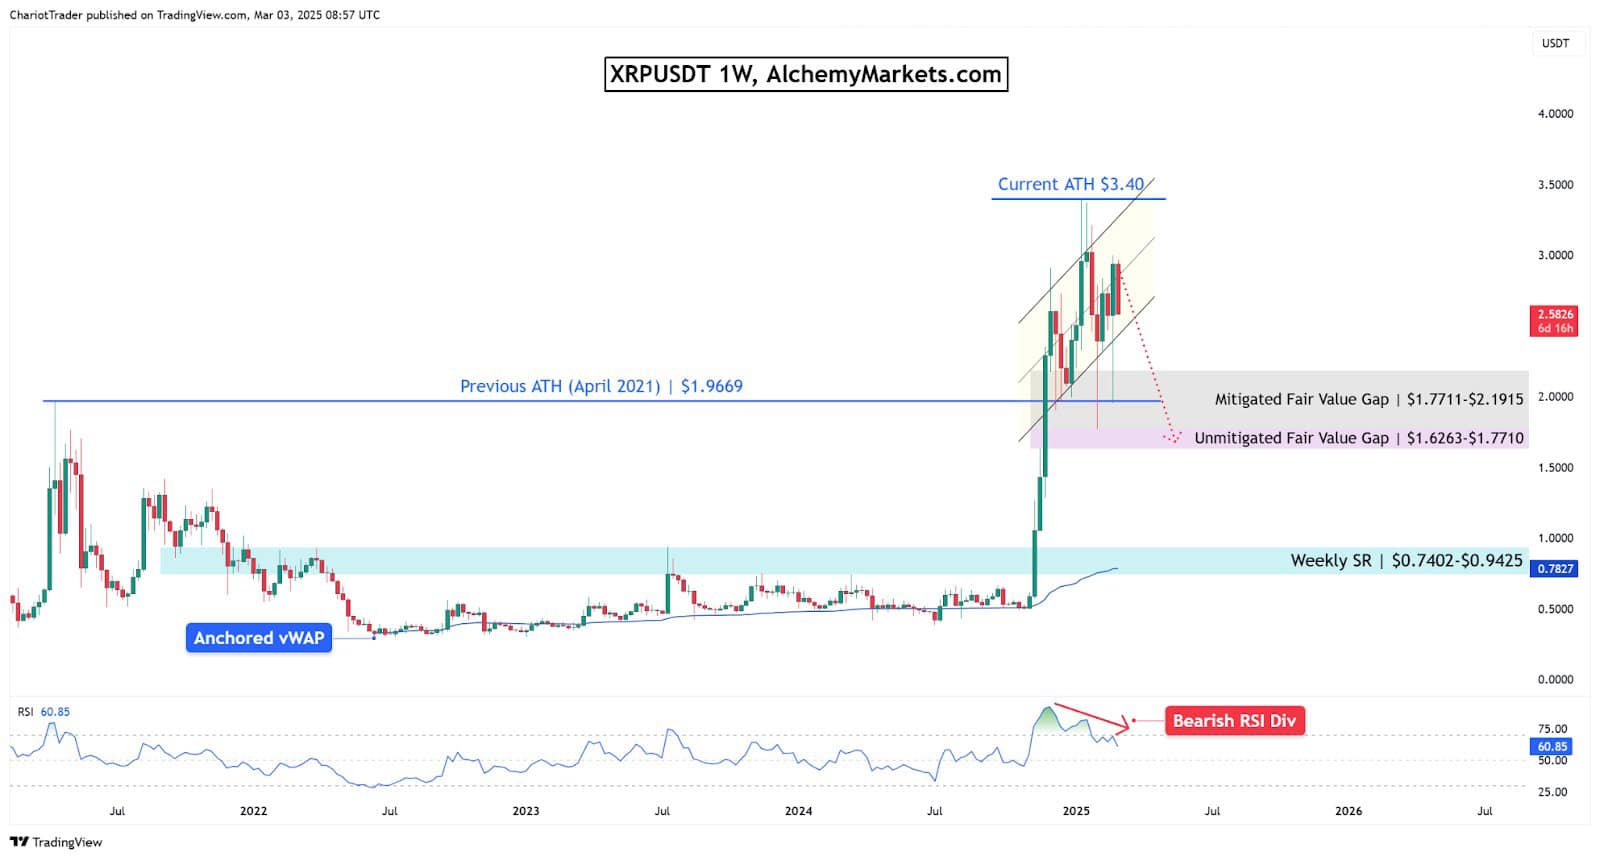
XRP’s rising channel formation, and weekly bearish divergence, signals the potential for a Head and Shoulders breakdown.
Bullish scenario: Bounce at the rising channel’s lower trendline.
Bearish scenario: Break of the rising channel, triggering the HNS and sending prices to the unmitigated FVG ($1.6263-1.7710).
Daily RSI: Has not hit oversold region since July 2024.
Solana (SOL) 1W Chart
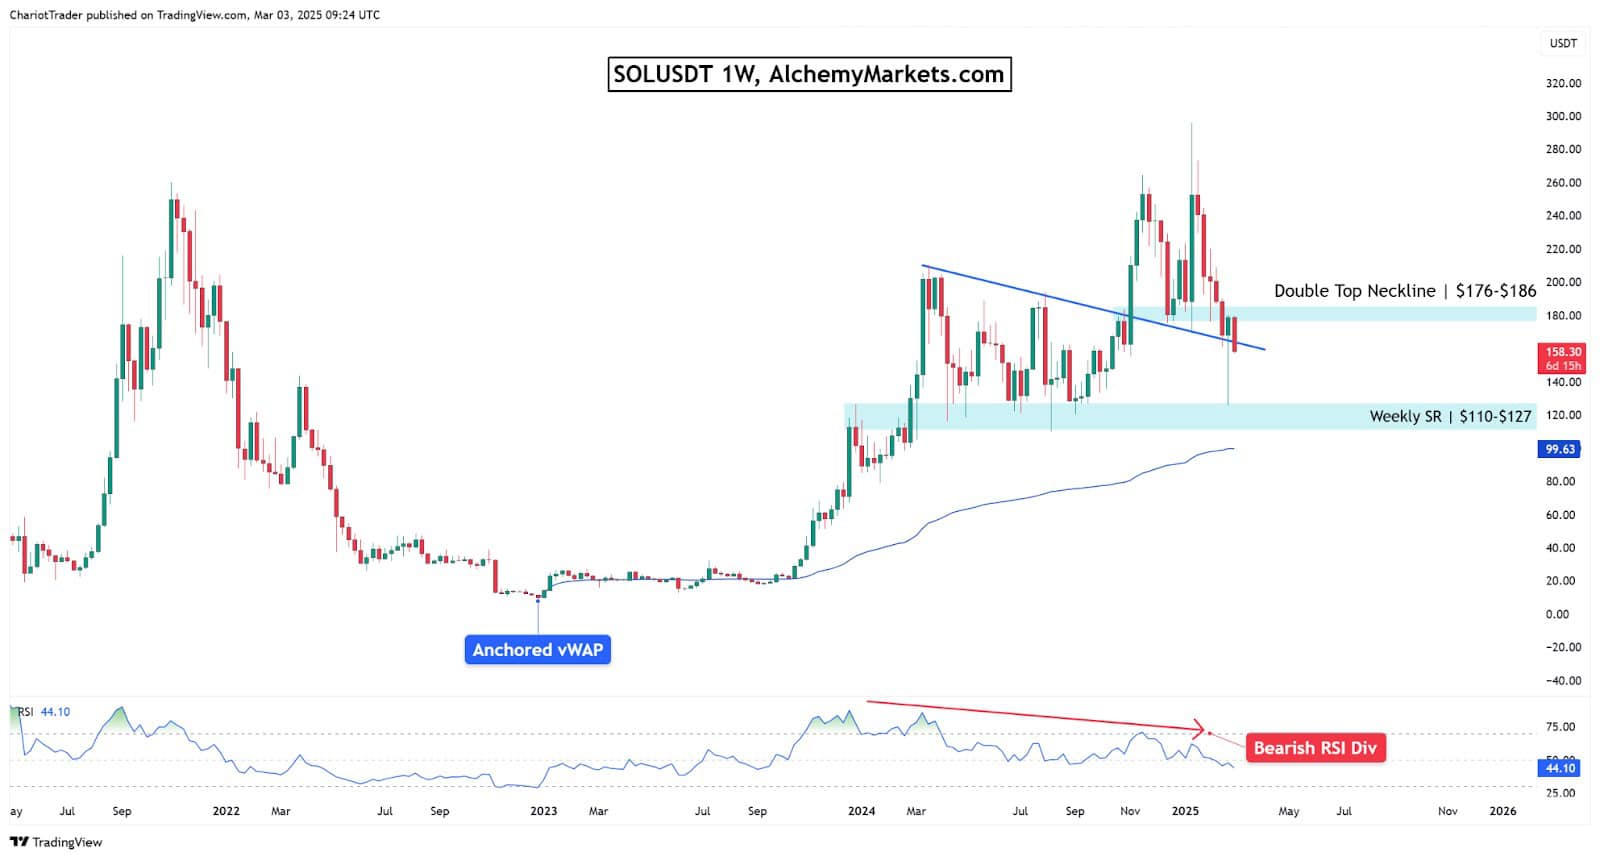
Solana has broken down from a double top, with weekly bearish RSI divergence. A descending trendline supported the price for two weeks, but we need to close above that trendline to remain bullish.
Bullish scenario: Close above the blue trendline.
Bearish scenario: Break of the blue trendline could send us to the Weekly SR zone at $110, or even the anchored vWAP at $99.63.
Daily RSI: Hit oversold on February 27th, suggesting bearish exhaustion.
Cardano (ADA) 1W Chart

Cardano has recently tested its anchored vWAP twice, within the past 4 weeks. It must overcome the key SR level or hold $0.7059 to remain bullish.
Bullish scenario: Hold the weekly SR at $0.7059, or overcome $1.2743.
Bearish scenario: Break below weekly SR at $0.7059.
Daily RSI: Hit oversold on February 9th, suggesting bearish exhaustion.
Slightly Bearish: USDT.D Approaching Critical Support at 4.37%
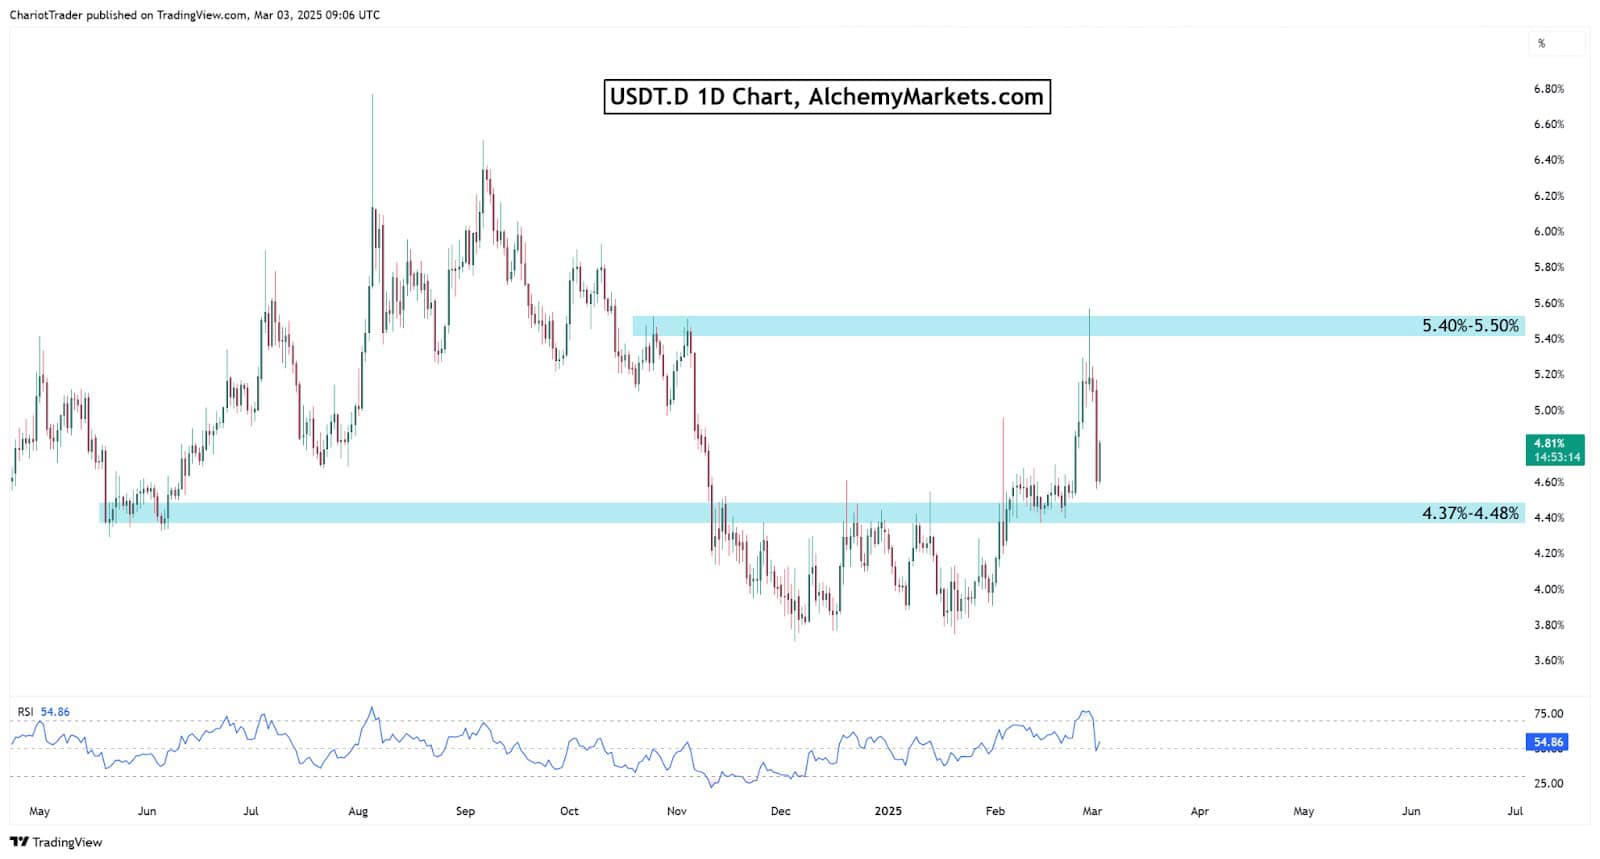
After a rejection at critical resistance at 5.40%, the inversely correlated USDT.D chart now is falling towards the critical support at 4.37%.
Should this support zone hold, it would support the case for bearish scenarios on all mentioned assets. Conversely, a breakdown of this support zone (with a daily candle close below), would be massively bullish for the crypto market.
You may also be interested in:


