


Written by:


- Opening Bell
- June 24, 2025
- 3 min read
Analysing the Impact on US Oil and Key Technical Levels
The recent announcement of a ceasefire agreement in a major Middle Eastern conflict has introduced a notable shift in sentiment across the global energy markets. As geopolitical tensions ease, the risk premium typically embedded in crude oil prices has started to unwind—translating into immediate downside pressure on benchmarks like US Oil (WTI Crude).
Historically, geopolitical instability in the Middle East—a key production region—has led to supply fears, driving oil prices higher. Conversely, any sign of stabilisation or peace tends to reverse that dynamic. The current ceasefire, seen as a strong step toward broader regional de-escalation, has temporarily alleviated fears of disrupted supply chains or production cuts, leading to the recent pullback in oil prices.
Why Oil Prices Dropped After the Ceasefire
The market’s reaction to the ceasefire is driven by basic economic principles of supply and demand expectations:
- Reduced Geopolitical Risk: With tensions declining, there is less concern over immediate supply disruptions, especially from critical oil-producing countries in the region.
- Strengthened Supply Outlook: Oil traders anticipate more stable output, possibly contributing to a global surplus.
- Lower Risk Premium: The embedded “fear factor” in oil prices due to war or sanctions tends to diminish once peace talks gain traction.
This downward adjustment in price is a textbook reaction and reinforces the view that current oil valuations are highly sensitive to geopolitical headlines.
US Oil Technical Chart: Price Action at a Key Inflection Point
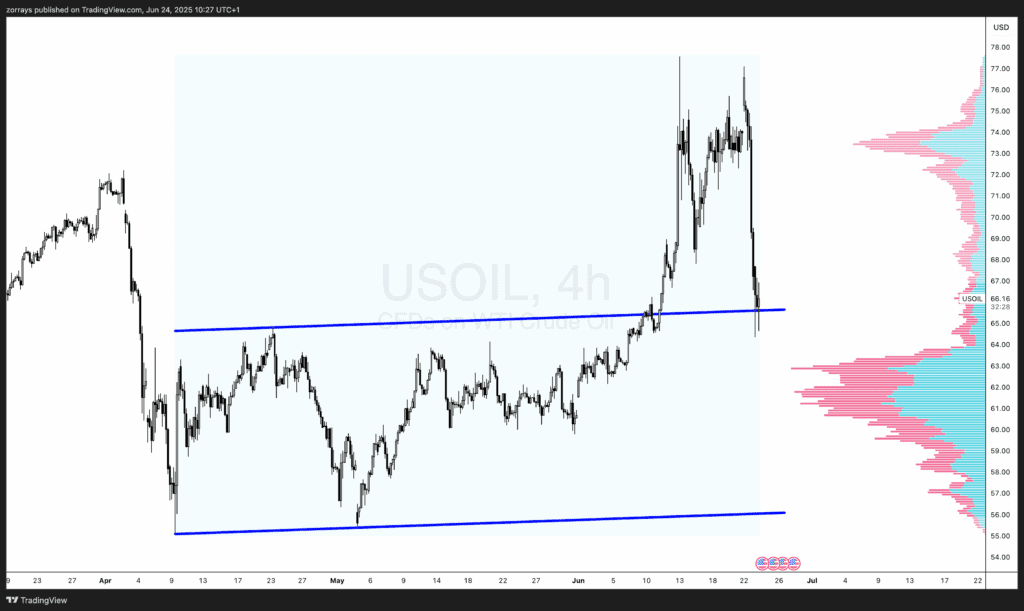
Looking at the US Oil (WTI Crude) 4-hour chart, the market recently pulled back sharply from highs around $77 following the ceasefire news. Importantly, this retracement has brought price action back into the ascending channel that had contained price since April.
Key Observations:
- Upper Boundary Retest: The price has now pulled back and is testing the upper bound of the previously broken ascending channel. This area may now serve as a potential horizontal support zone.
- Volume Profile Analysis: A high volume node (visible on the right side of the chart) between the $65-$66 range suggests strong interest and prior transaction volume. This is a key area where institutional players may re-engage.
- Support vs. Exhaustion: If this zone holds, it could provide the base for a bullish reversal, especially if buyers view the recent drop as an overreaction. However, if momentum has truly run out, this same area could see choppy consolidation or even act as a resistance zone if sentiment continues to deteriorate.
Conclusion
The ceasefire in the Middle East has created a fundamental catalyst for the current pullback in oil prices. However, the technical landscape shows that US Oil is at a critical juncture—hovering around the upper boundary of its previous trend channel and aligning with a significant high-volume node.
Whether this marks the beginning of a deeper correction or a pause before the next bullish leg will largely depend on price reaction at this level and ongoing developments in the geopolitical sphere.
As always, disciplined risk management and close monitoring of price structure are key in navigating such environments. The coming days will provide more clarity on whether this is a buying opportunity—or a warning sign of more volatility ahead.


