


Written by:


- Opening Bell
- July 21, 2025
- 5 min read
Genius Act Signed, Bitcoin and Alts Surge — What’s Next?
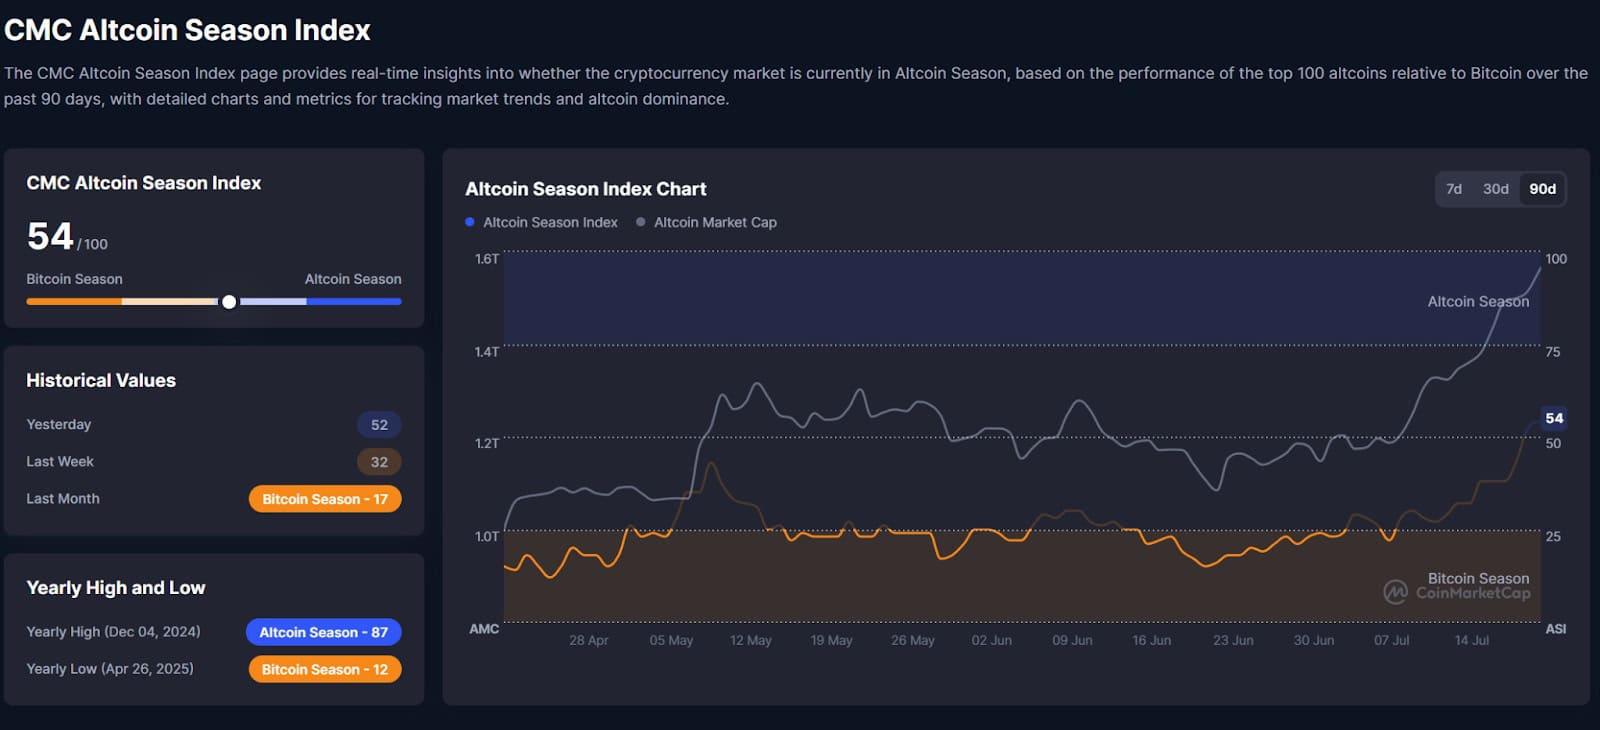
Bitcoin printed a record weekly high, Ethereum exploded over 20%, and the Altcoin Season Index just broke above 50 — a key threshold that hints alt momentum may only be getting started.
On the macro side, “Crypto Week” in Washington has delivered actual wins, with the Genius Act now law, and other major bills clearing the House.
If you’re waiting for a signal, this week might’ve just dropped three.
Crypto Week Recap
Last week was a critical moment for U.S. crypto policy:
- Genius Act Signed: Stablecoin regulation now official (1:1 USD/Treasury reserves, monthly audits, AML rules).
- ETH ETF Inflows: $727M in a single day, ~$2B+ in July alone.
- Alt Season Index: Climbed past 50 for the first time in months.
- Regulatory Momentum: Clarity Act + Anti-CBDC bill passed House.
Optimism for institutional adoption is running high, but full implementation could take 1–3 years.
Patience is required, so let’s look at some technicals.
Bitcoin is Coiling Up in a 4H Symmetrical Triangle
Bitcoin surged early last week, hitting the $120K–$123K range before getting rejected near the 78.6% fib extension. Since then, it’s formed a symmetrical triangle on the 4H chart, a classic consolidation pattern before large breakout moves.
Volume is clustering at the apex of the triangle, visible through the anchored volume profile, showing aggressive positioning ahead of a likely breakout.
Technicals to Watch:
- 🟩 Measured move (UP): $126,000
🟥 Measured move (DOWN): $110,000 - 📉 Reclaim needed: All-time high at $122,960
- ⚠️ CME gap: $114.4K–$115.6K
- 🧲 High-volume node: ~61.8% fib, overlaps with $110K–$111K
- 🔵 Anchored VWAP from June lows aligns with $110K support
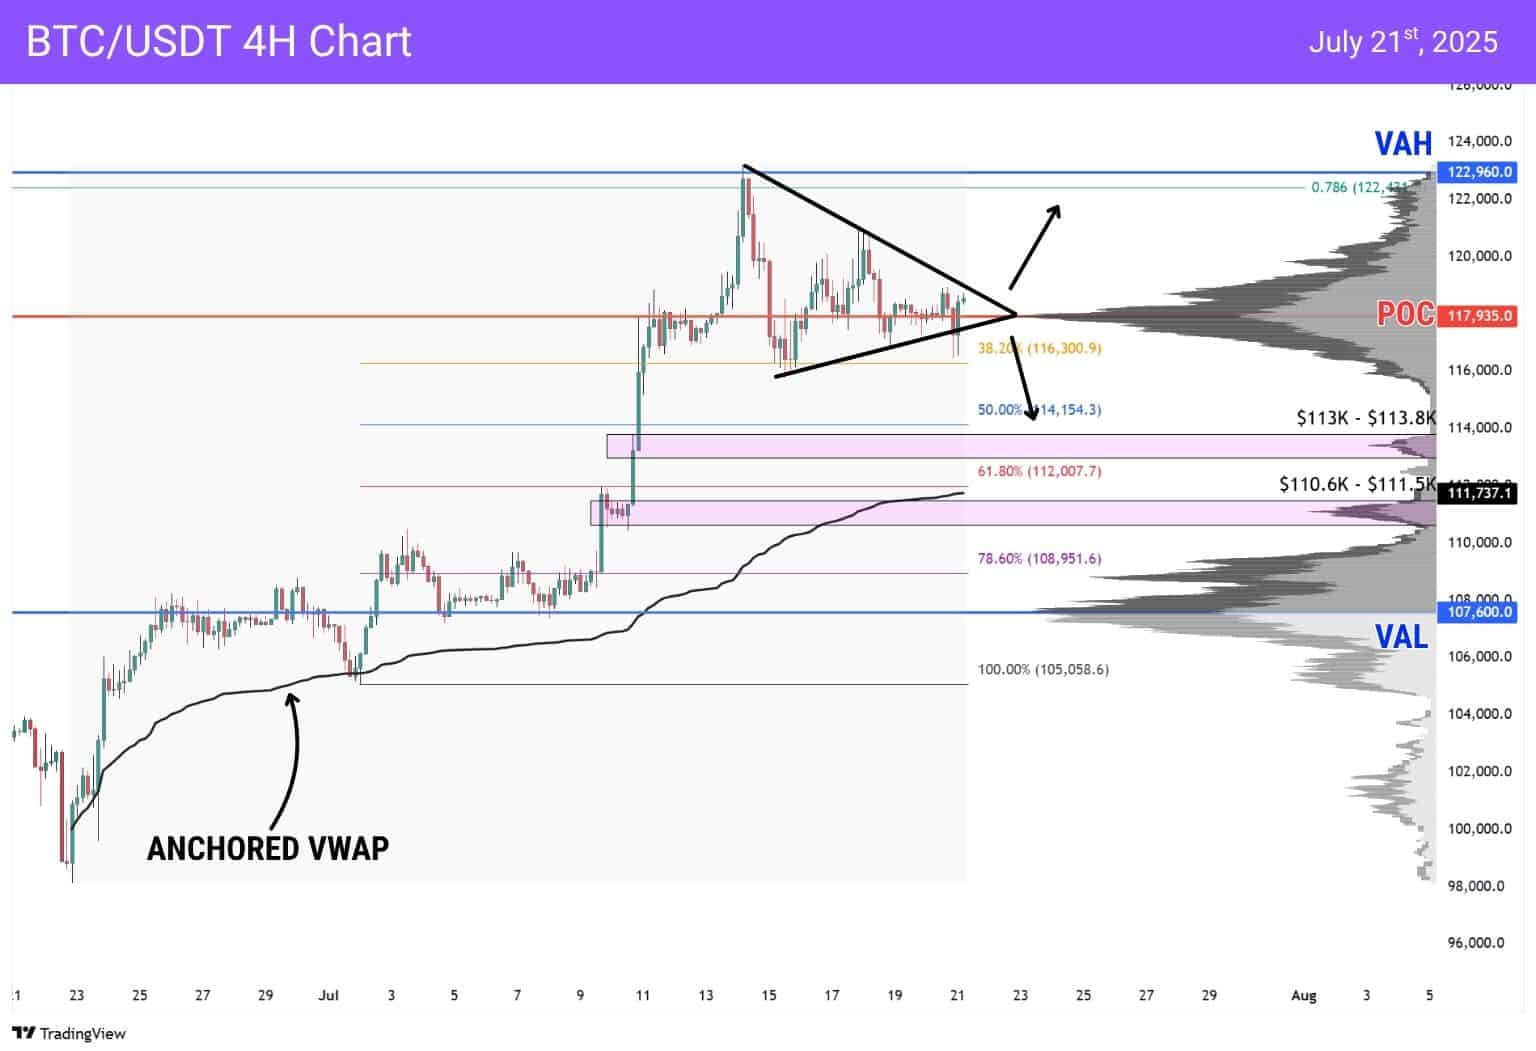
If price breaks out upward, it’s not enough to just pierce the ATH, it must hold above $122,960 with strength to avoid another fakeout.
If price breaks downward, the most logical path is:
- Fill the CME gap
- Drop into the 110K–111K area, where strong historical support and volume structure sit in confluence with the anchored VWAP.
A retest and hold of $110K could actually be bullish in the mid-term, setting up the next leg.
ETH/USDT is On a Massive Run, and ETH/BTC Shows Strength
Ethereum gained over 26% last week, massively outperforming Bitcoin, which ended the week red (-1.48%). The rally has been backed by over $2B in ETF inflows since early July, including $727M in a single day — the strongest daily figure to date.
ETH/USDT formed a solid base at the $2,560–$2,654 range, where anchored VWAPs from the December 2024 high and April 2025 low converge with the VAL. From there, price exploded upward, and is now approaching volume resistance zones.
Technicals to Watch:
- 🟩 Base Support: $2,560–$2,654
- Anchored VWAP agreement near VAL
- Previously broken resistance flipped cleanly into support
- 🟪 Retracement Zone: $3,268–$3,361
- Consolidation cluster from 2024
- Matches volume shelf mid-range
- 🎯 Bullish Target: $4,000–$4,100
- Final resistance before ATH zone
- Final resistance before ATH zone
- 🛑 Macro Resistance: $4,624–$4,868 (ATH zone)
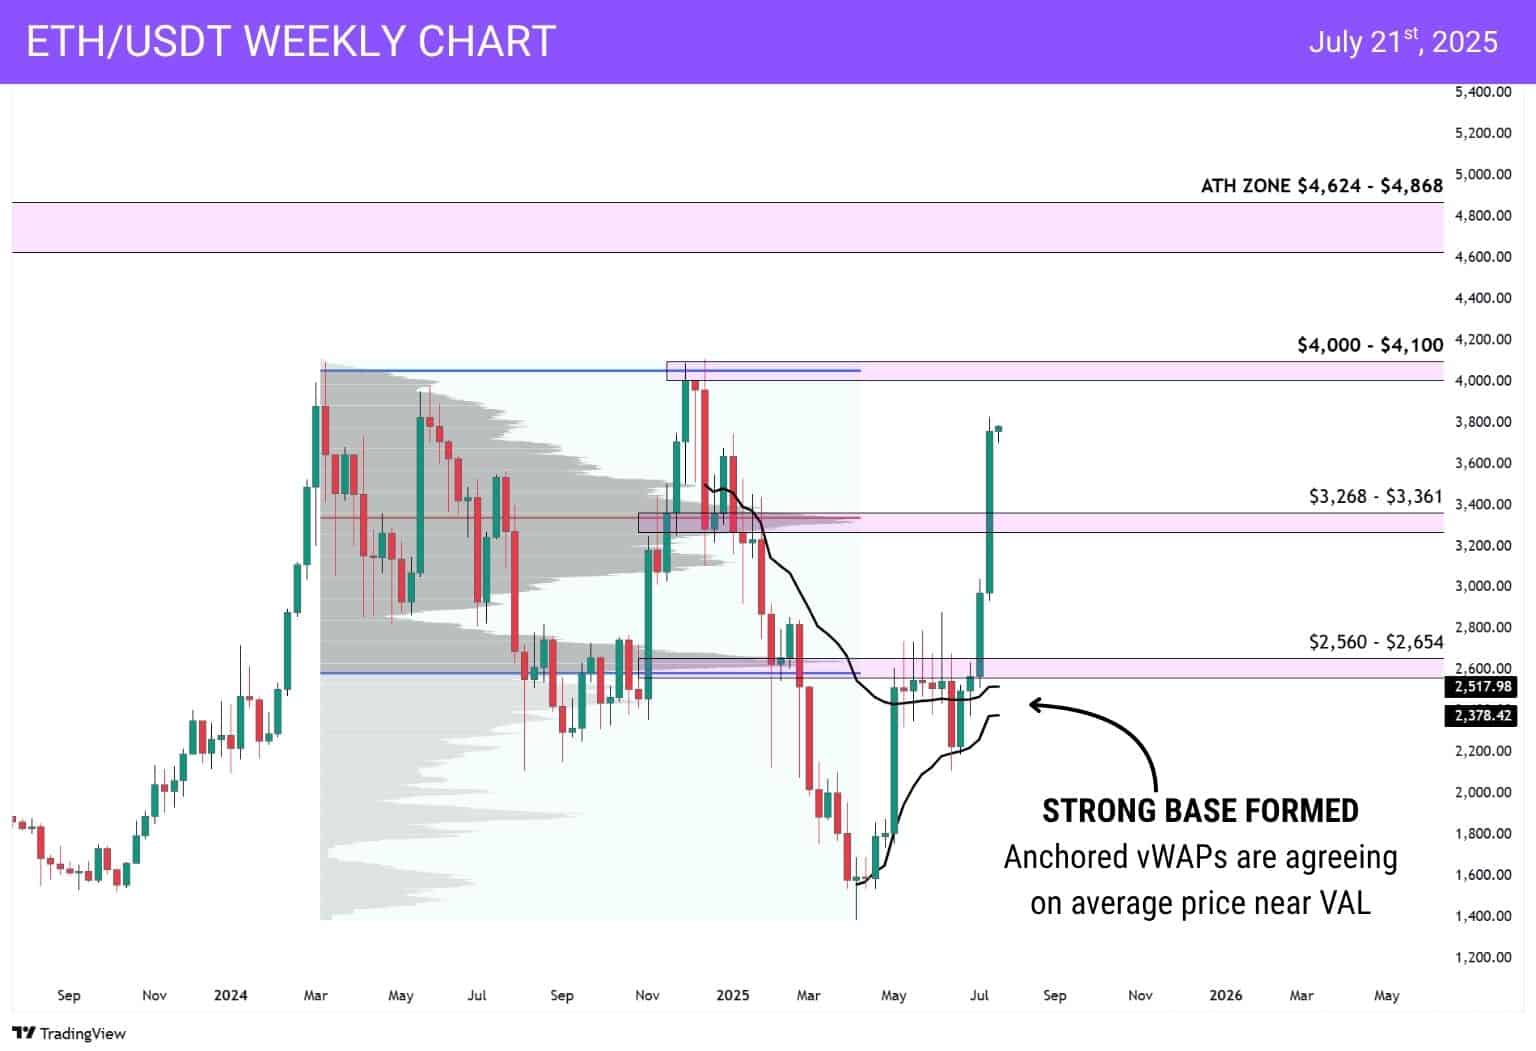
ETH/USDT is moving with conviction, but keep in mind that a retest of the $3,268–$3,361 area wouldn’t invalidate the trend — it would simply be a healthy mid-cycle check.
ETH/BTC has bounced from the ₿0.0224 zone, and is now approaching a critical macro trendline that’s held since July 2022. This trendline intersects with a high-volume node at ₿0.0385, making this a major breakout level.
If ETH clears that area, the upside opens up fast.
Technicals to Watch:
- 📈 Immediate Resistance: ₿0.0340–₿0.0356
- Former support now flipped
- High volume shelf confirmation
- 🔺 Breakout Level: ₿0.0385
- Multi-year descending trendline
- High volume node intersection
- 🎯 Macro Target: ₿0.0515
- If trendline breaks, room for a 19.80% rally from current level
- If trendline breaks, room for a 19.80% rally from current level
- 📉 Key Support: ₿0.0268–₿0.0281
- Structure + previous breakout zone
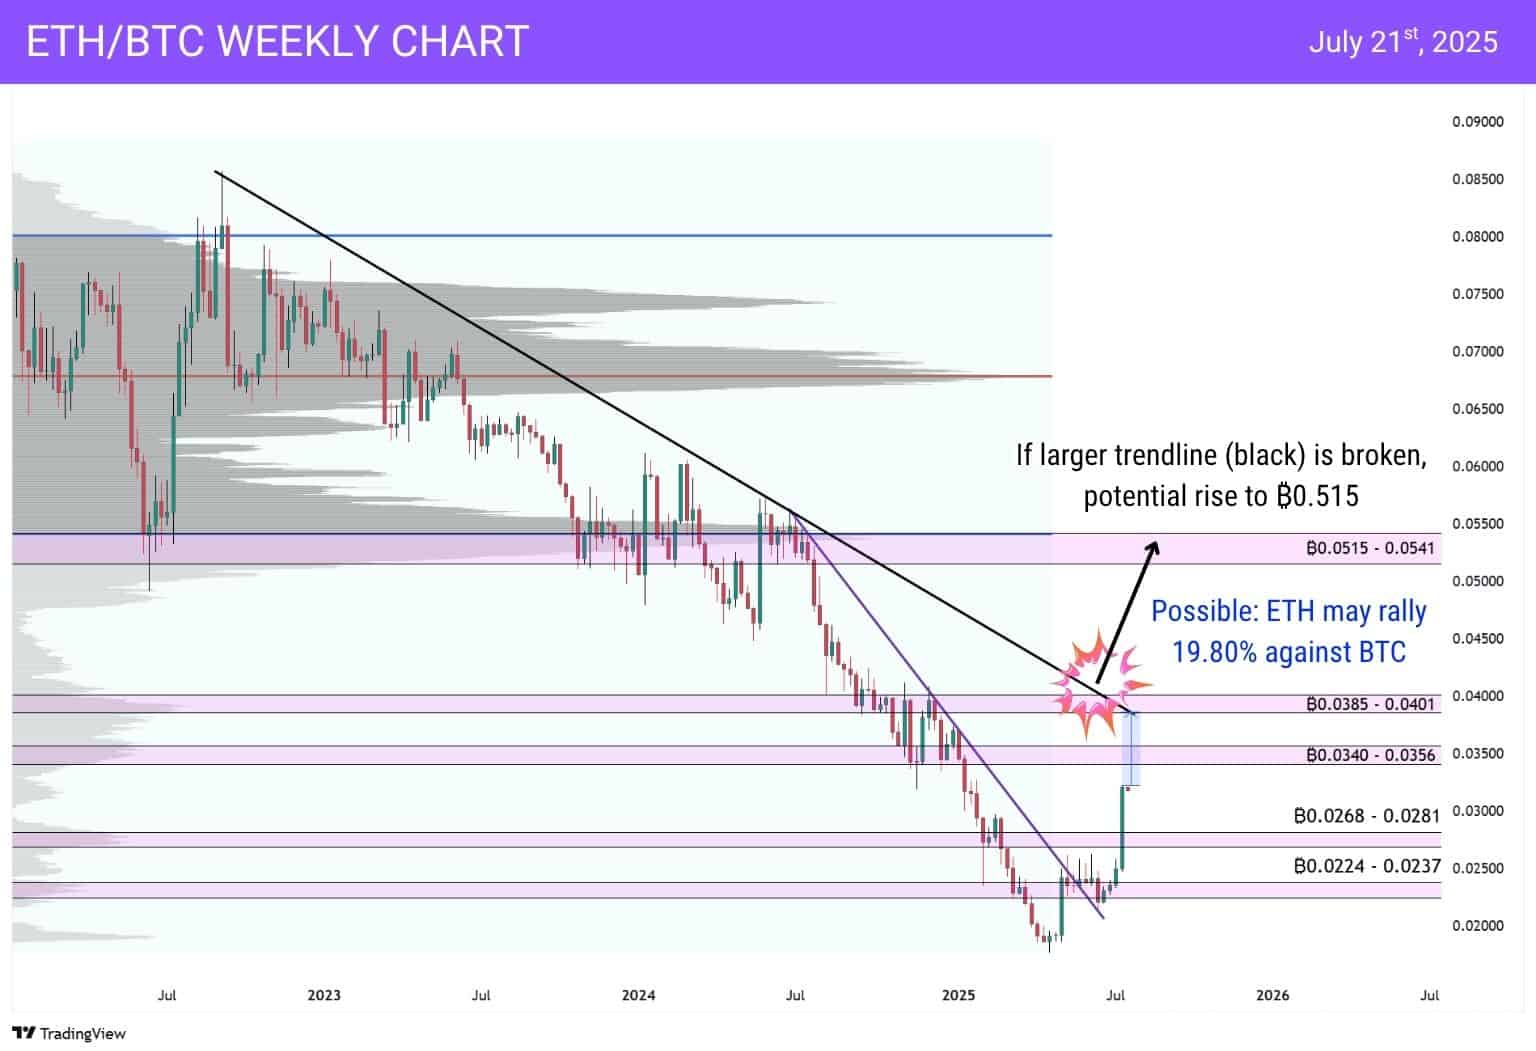
If ETH breaks ₿0.0385, this would likely lead to a multi-week capital rotation out of BTC into majors, then eventually mid-cap and low-cap alts — the typical alt season cascade.
TOTAL2 Altcoin Market Cap is in a Rising Channel
TOTAL2 — which tracks the altcoin market excluding BTC — is pushing toward the top of a rising logarithmic channel that’s been intact since late 2022.
The move is orderly, supported by solid structure, and currently testing one of the final resistance zones before price discovery. But this is also where rallies typically cool off, especially if Bitcoin chops or rejects from its own ATH region.
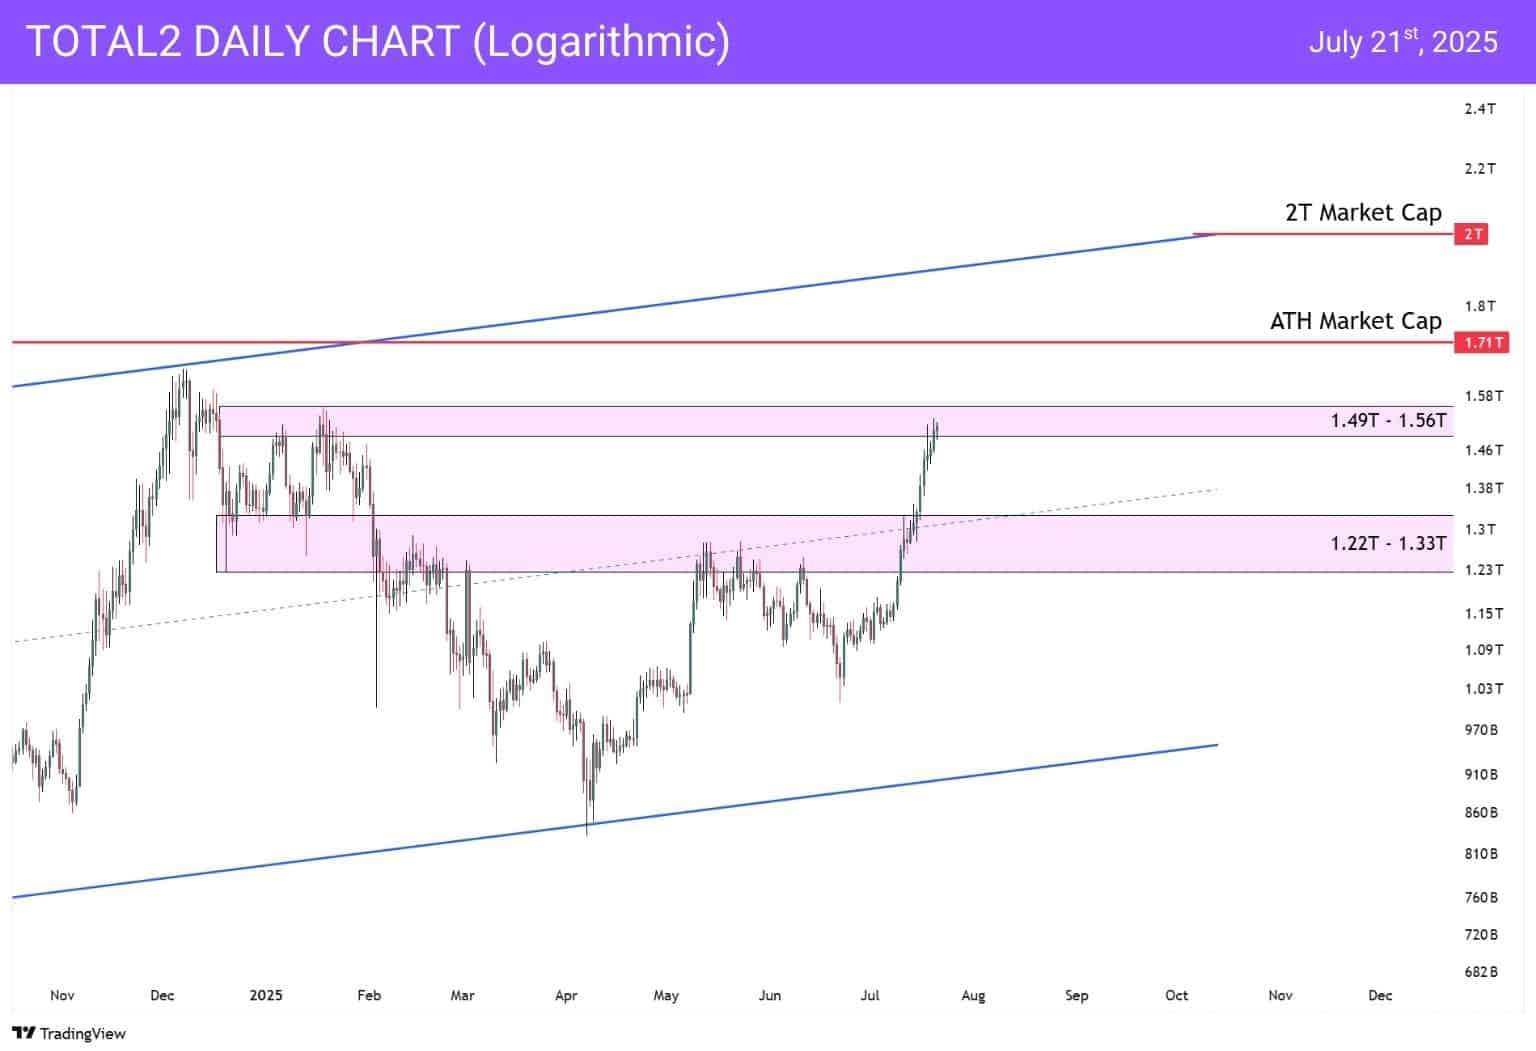
Technicals to Watch:
- 🟦 Local Support Zone: $1.22T–$1.33T
- Former resistance turned support
- Base of the last breakout
- ⚪ Mid-Channel Support: ~$1.32T
- Acts as dynamic support in rising log channel
- Validated multiple times historically
- 🟪 Current Resistance Zone: $1.49T–$1.56T
- Top of local supply
- Strong historical rejection in April
- 🔺 Macro Resistance: $1.71T (All-Time High Market Cap)
- Final ceiling before blue-sky
- Final ceiling before blue-sky
- 🎯 Breakout Objective: $2T
- Top boundary of the channel
- Would mark full alt season expansion
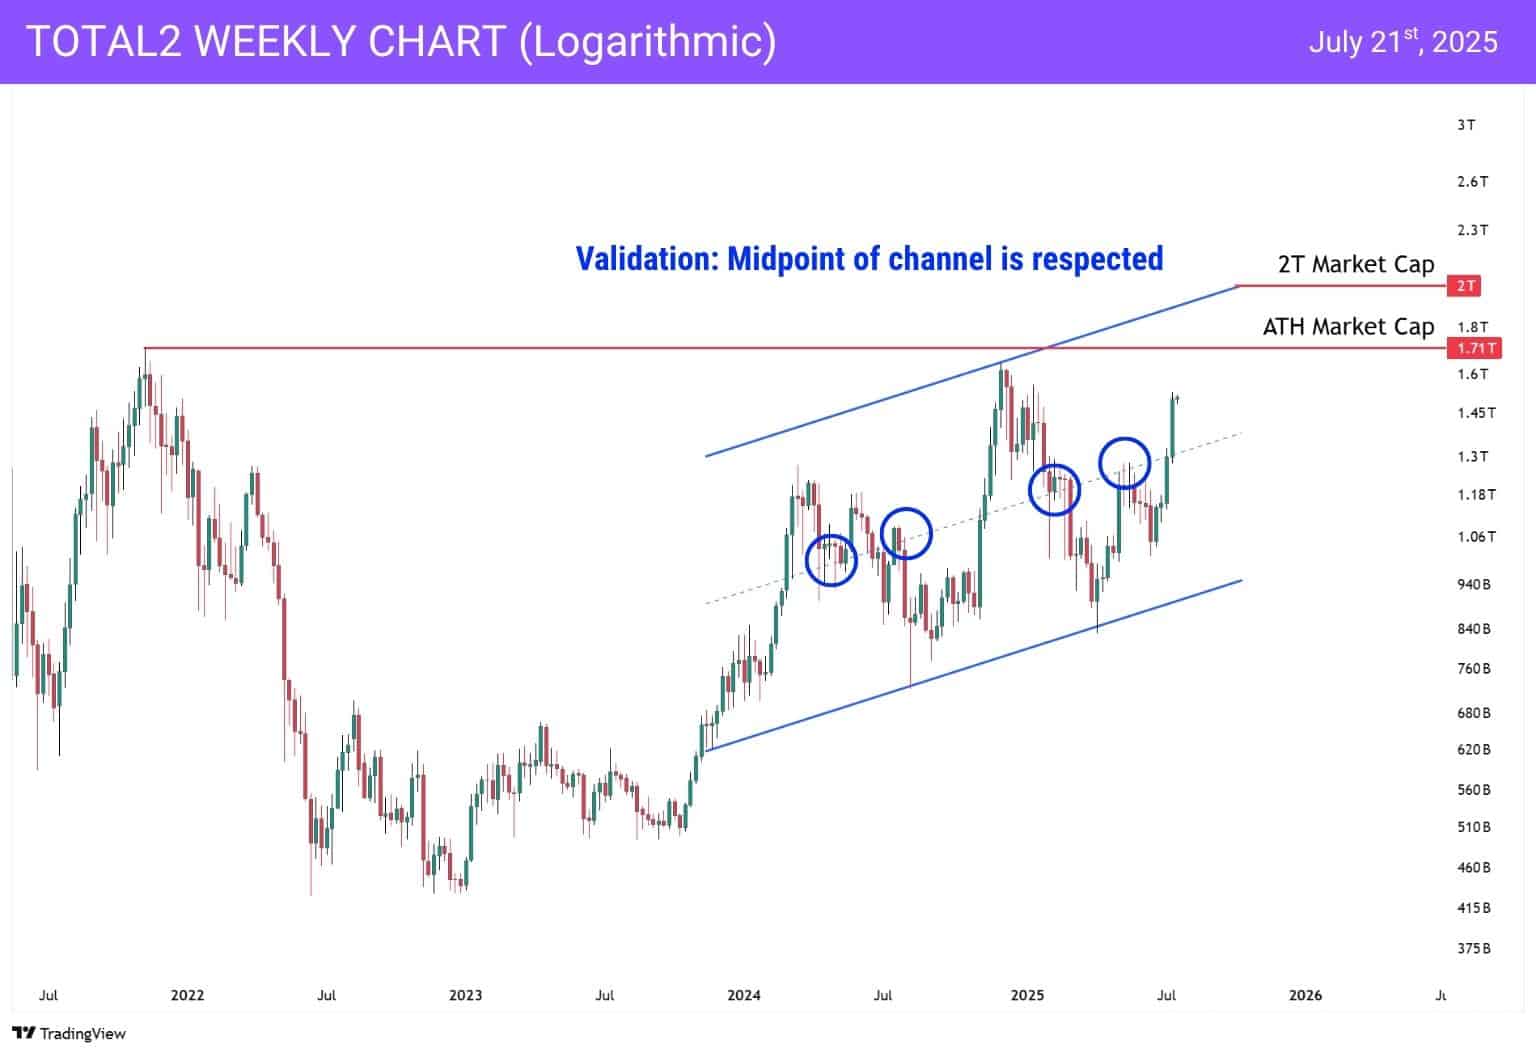
TOTAL2 shows that alts are climbing in a structured way, but they haven’t exploded yet. This zone between $1.49T and $1.71T is the proving ground.
- Hold it and we could be looking at a full-scale alt season.
- Fail it and we likely range or dip.
Conclusion — Breakout or Fakeout?
The market is showing serious signs of strength — but it’s not a free-for-all just yet.
Bitcoin is coiling, Ethereum is running, and the broader altcoin market is pressing into major resistance. Whether we explode higher or fake out depends on two key conditions playing out this week:
🔑 What Needs to Happen:
- BTC must break and hold above $122,960 — reclaiming the ATH decisively
- ETH/BTC must break ₿0.0385 — confirming rotation into alts
- TOTAL2 must sustain above $1.49T–$1.56T — turning resistance into support
🚨 What to Watch:
- A pullback into $110K (BTC) or $3.3K (ETH) is not bearish unless those levels break
- If ETH/BTC fails at trendline resistance, altcoin momentum likely pauses
- If BTC stalls near ATH while ETH/BTC breaks out — ideal alt season conditions
You may also be interested in:


