


- Elliott Wave
- April 14, 2025
- 2 min read
USD/JPY Elliott Wave: Yen-sational Breakdown Brewing?
Executive Summary
- Trend Bias: Bearish impulse underway following completion of large corrective pattern.
- Key Levels: 146.54 is now key resistance; below 139.58 opens deeper decline.
- Indicators: RSI pings lowest level since August 2024.
Current Elliott Wave Analysis
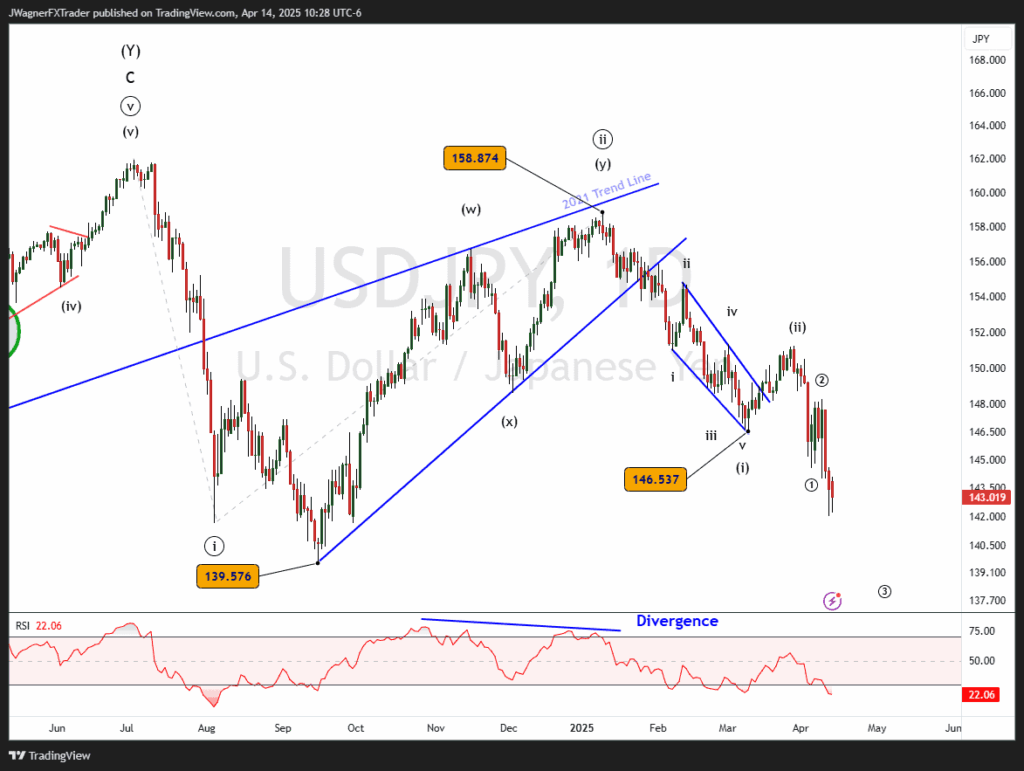
The daily USDJPY chart illustrates a completed Elliott wave corrective structure at higher degree, labeled as a double zigzag (w)-(x)-(y). This pattern terminated at 158.87 on January 10.
From this high, price action has transitioned into a clear bearish motive wave, suggesting a trend reversal from up to down has begun.
At the Minuette degree, we have:
- Wave (i) bottoming at 146.54 after a clean five-wave decline.
- Wave (ii) retraced sharply into the 151.15 area in late March and held below the 158.87 high, preserving the impulsive structure.
- Wave (iii) appears to be in progress, currently extending below the 143 handle, with strong downside momentum evidenced with the lowest RSI reading in 8 months.
At the smaller degree of trend within wave (3), subwaves ① and ② appear to be in place. Wave ③ should begin to accelerate lower if this wave labeling is correct. The RSI reading should continue to hold lower levels.
The current downtrend appears to have a ways to go. Zooming out, a Fibonacci extension of wave ((i)) projected from the end of wave ((ii)) gives a 1.618 target around 128. We anticipate wave (iii) to make the most progress towards 128.
Bottom Line
USD/JPY is in the throes of a developing bearish impulse, with strong downside continuation expected. We anticipate USDJPY to hold below 146.54 resistance as the down trend pushes towards 128. Prices above 146.54 will force us to reconsider the current wave count plus other alternate wave counts.
You might be interested in:


