


- Elliott Wave
- May 29, 2025
- 2 min read
USDJPY Carves Shooting Star [USDJPY Bearish Elliott Wave]
Executive Summary:
- USDJPY bearish shooting star pattern today
- A break below 142.10 may accelerate to 130 and 122
- 148.65 is bearish key level
Elliott Wave Pattern on USDJPY
The daily chart for today’s USDJPY price yielded a shooting star formation. This is a bearish pattern and suggests a larger decline may develop.
Couple the bearish candlestick formation with a bearish Elliott wave count and we have a recipe for a large decline to unfold.
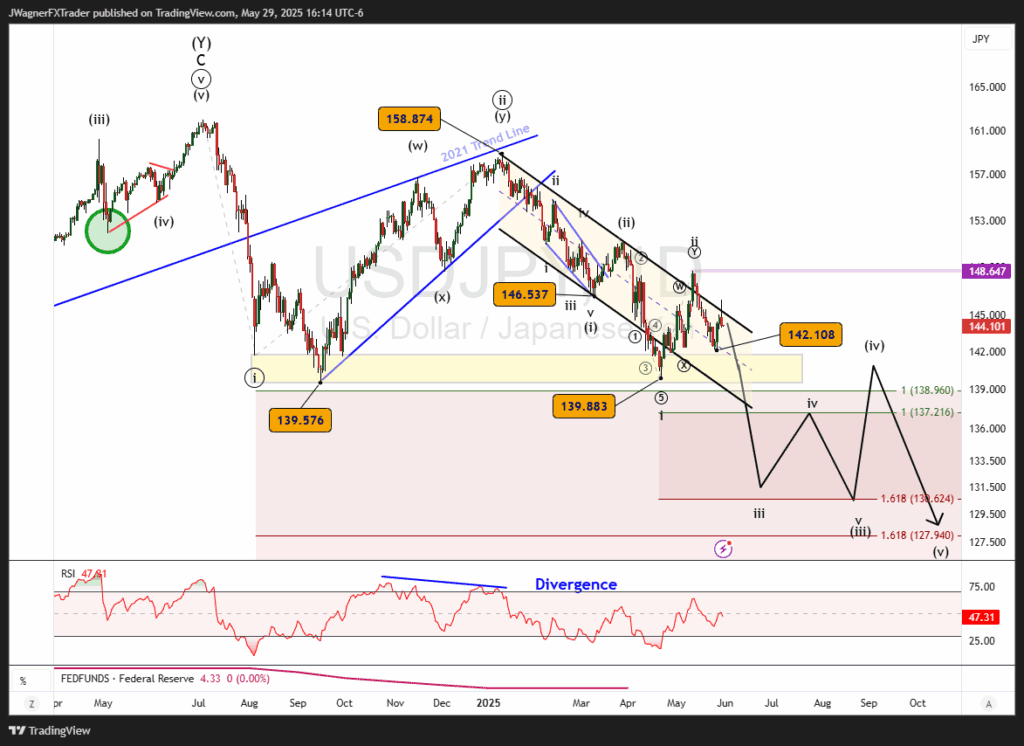
We’ve been bearish for quite some time as the larger pattern reveals a large third wave unfolding. Now, after a series of bearish (i)-(ii)-i-ii patterns suggests that USDJPY could be in line for a wave 3 decline at three degrees of trend. If true, this would be a large scale decline that dramatically punches below the 139-141 support shelf and continues to much lower levels.
The target for wave iii, using the Fibonacci extension tool, arrives near 130, with a downtrend to 122 possible.
Wave (ii) and wave ii each last about 20 calendar days. Therefore, this large bearish pattern may show its hand within a couple of weeks by mid-June.
Bottom Line
USDJPY carved a bearish shooting star candlestick with today’s price action. Additionally, the Elliott wave count appears to be setting up for a wave 3 decline at three degrees of trend. Initial downside targets are 130 and 122 with lower levels possible.
You might be interested in:


