


- Elliott Wave
- June 19, 2025
- 2 min read
USD/CAD Elliott Wave: Relief Rally Underway
Executive Summary:
- Medium-Term Bottom: A 3rd wave likely completed on Monday June 16, a relief rally is underway.
- Bearish Impulse Developing: The 1D chart suggests after a 4th wave rally, one more decline in a 5th wave to new lows.
- Key Level to Watch: Upside targets for wave ((iv)) includes 1.3914.
Current Elliott Wave Analysis
Daily Chart (1D)
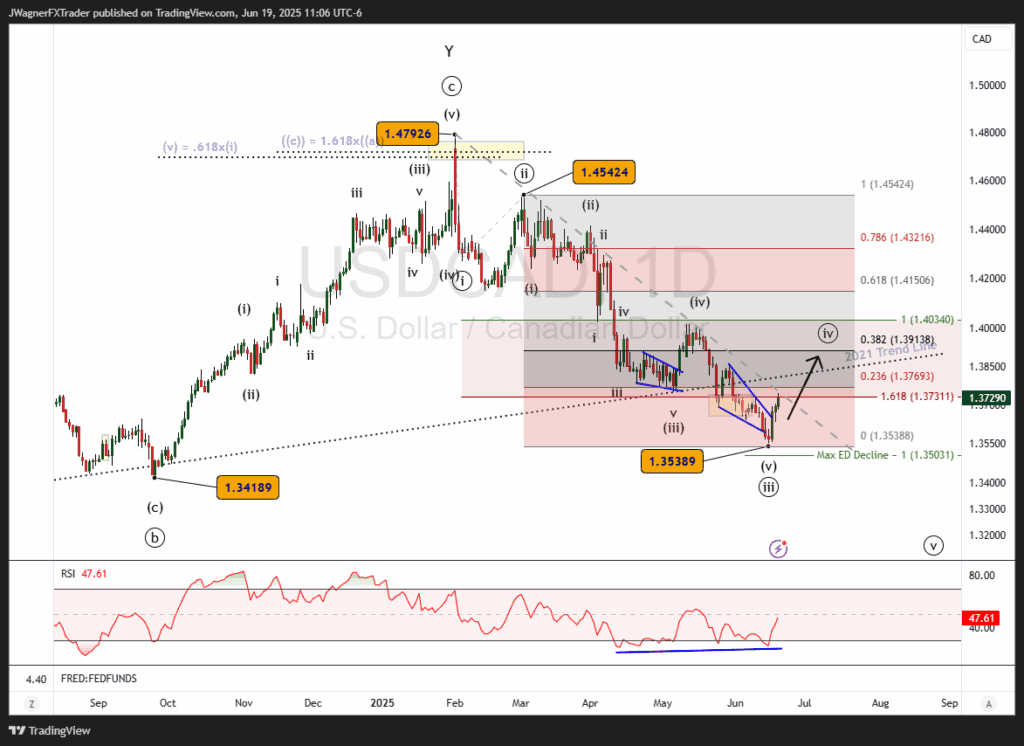
A medium-term bottom was found for USD/CAD on Monday, June 16. Our Elliott wave analysis suggests the low is the end of a 3rd wave and the current rally is a fourth wave.
The wave ((iii)) decline needed three months and 1,000 pips to unfold to the downside. The larger downtrend does appear incomplete, but a relief rally is needed to consolidate the recent losses.
Using Elliott wave as our guide, it is common for 4th waves to retrace a Fibonacci 38% of the 3rd wave. This would set an upward target near 1.3914. If USDCAD were to rally near this level, then we’ll review the maturity of the wave count and be on alert for another top in wave ((iv)).
You’ll also notice a trend line dating back to 2021 that USDCAD has broken down. It is common that when support is broken, it acts like new resistance in the future.
Therefore, USD/CAD may retest this trend line from the bottom side. The trend line is currently passing through just above 1.38. Look for this trend line and the Fibonacci 38% retracement level to offer resistance between 1.38-1.3914.
Bottom Line
USD/CAD appears to have reached a medium-term bottom in wave ((iii)). This implies a wave ((iv)) rally that likely reaches 1.3914. Additionally, a broken support trend line dating back to 2021 is looming nearby.
We anticipate the rally to be a partial retracement higher that leads to new lows below 1.3538.
You might be interested in…


