


- Elliott Wave
- August 7, 2024
- 3 min read
Nikkei Elliott Wave: Correction Appears Incomplete
Executive Summary
- Japanese candlestick patterns reflect sentiment for Nikkei
- A major top likely registered in July 2024
- A decline to 29,000 and possibly 23,000 is underway
Shooting Star Top in July Signals Large A Large Correction
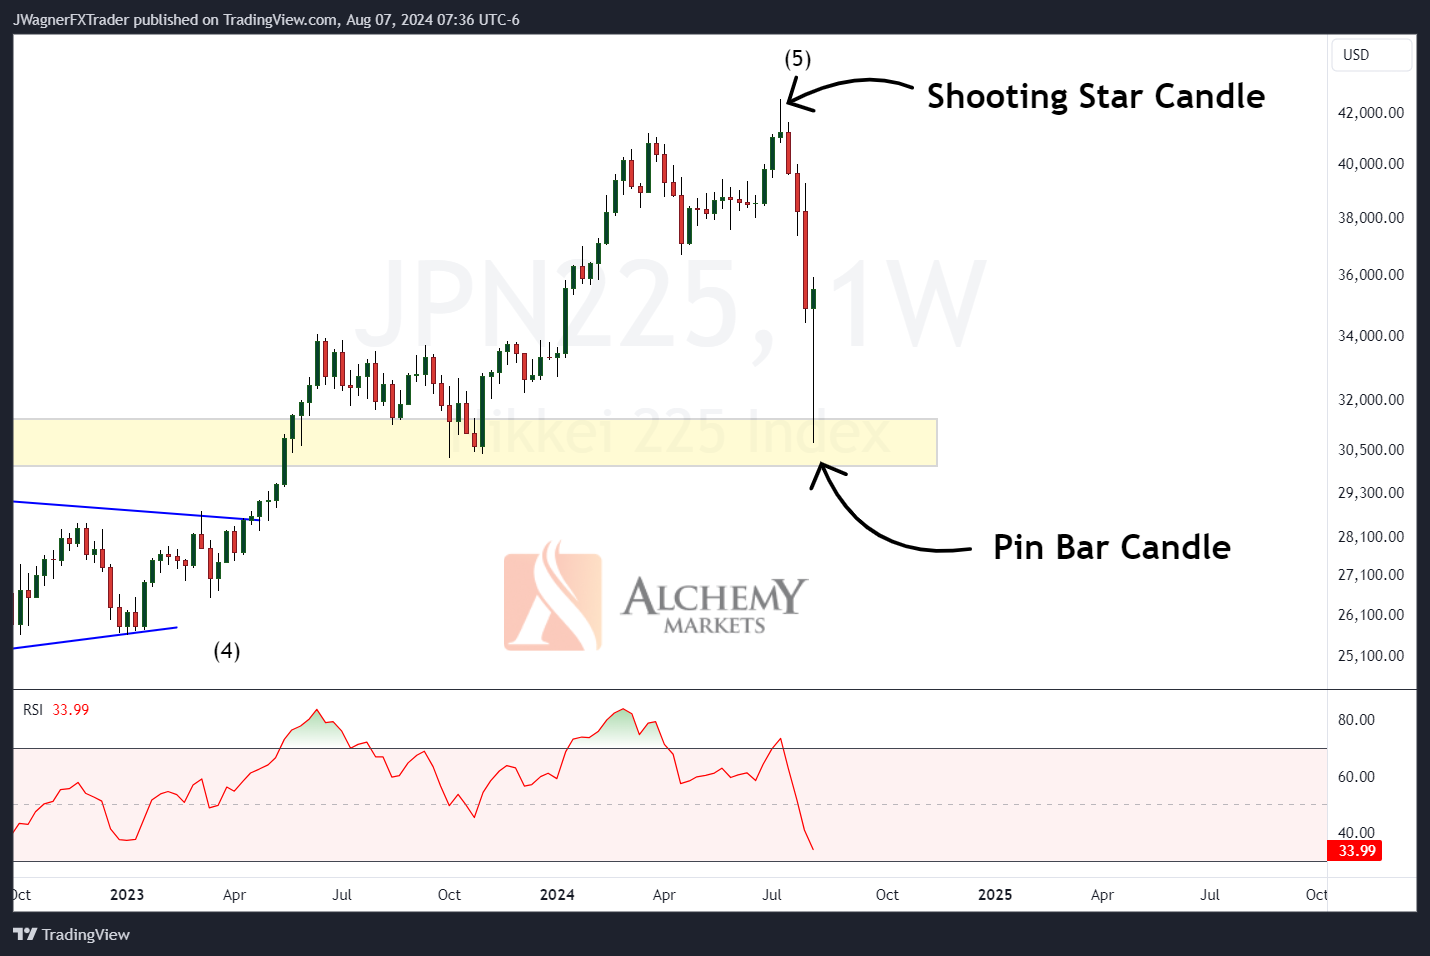
Japan’s Nikkei price carved a shooting star pattern on the weekly chart back in July. The shooting star is a Japanese candlestick pattern, a bearish formation, and signals weakness on the horizon.
Sure enough, Nikkei sold off 28% from that shooting star high to this week’s low.
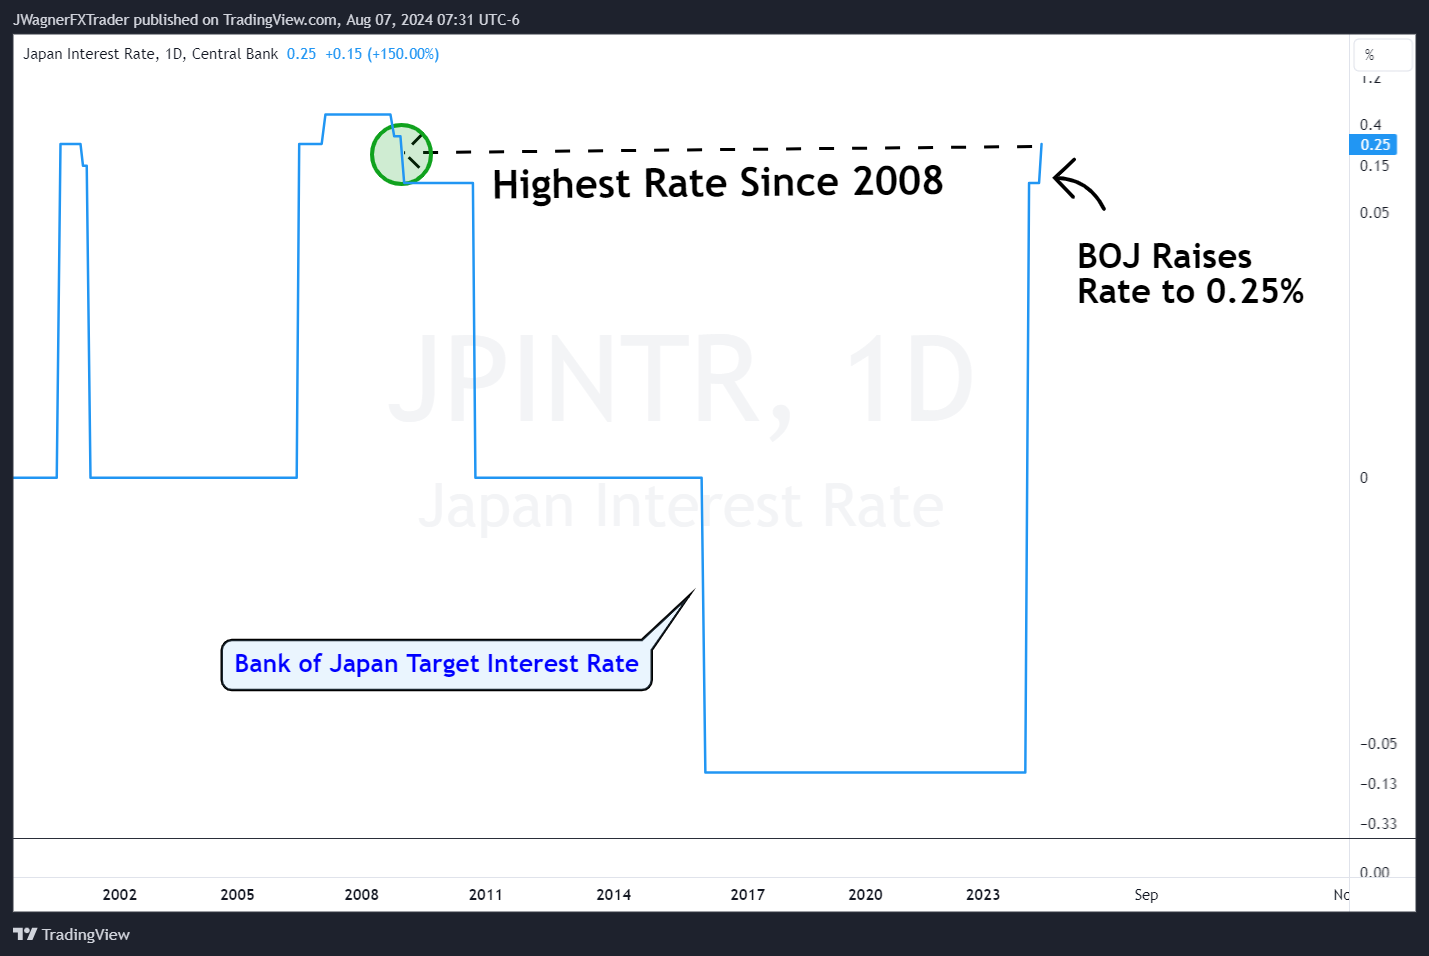
The bulk of that weakness was driven by the Bank of Japan increasing their target interest rate to 0.25%. This is the highest Japan’s interest rate has been since 2008. For the past 16 years, investors have grown accustomed to extremely low and sometimes negative interest rates from Japan. The interest rate would impact anything Japanese related from the Yen to Japanese equities like the Nikkei.
As a result, the relatively high rate of interest is shocking Japan’s investors as they reallocate their resources.
After the strong decline, a pin bar candlestick pattern has begun to form this week. The weekly candle is still in development as the week hasn’t ended yet. But if prices remain near current levels, the bullish pin bar might suggest a continued rally.
What is the Current Elliott Wave Count?
The current Elliott wave count is wave A of a larger corrective pattern. This bearish pattern began in July so we can’t say for sure what corrective pattern is unfolding.
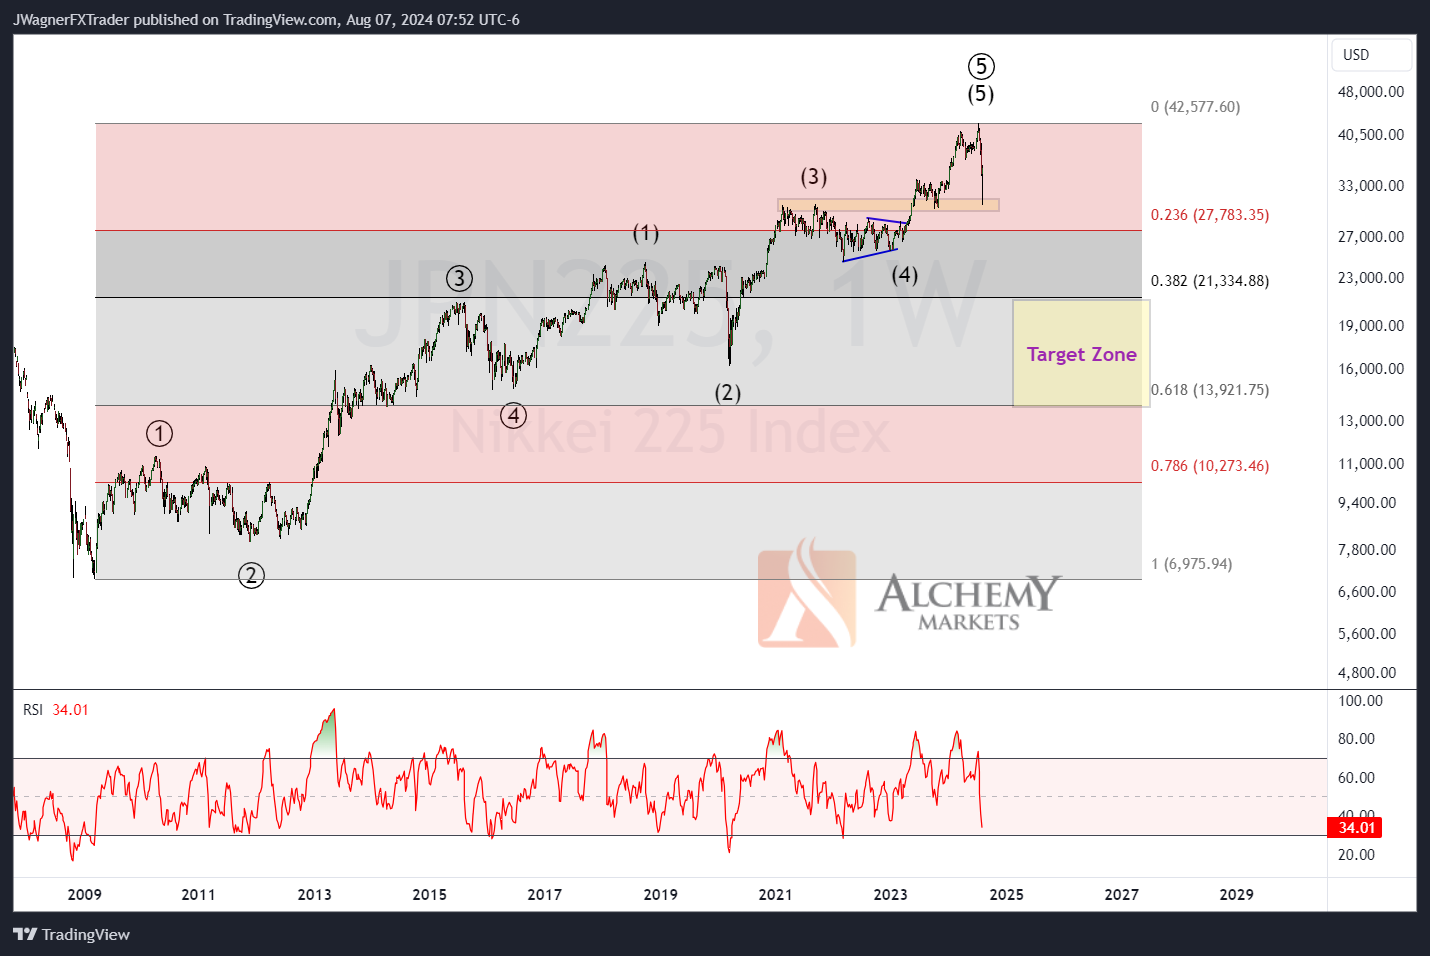
However, it does appear that a large degree impulse wave pattern from 2009 to 2024 has ended. Therefore, the next corrective decline may take multiple years to unwind and could carry down to 13,921-21,334.
That’s a long time and a wide target. Therefore, let’s poke around a smaller time frame chart.
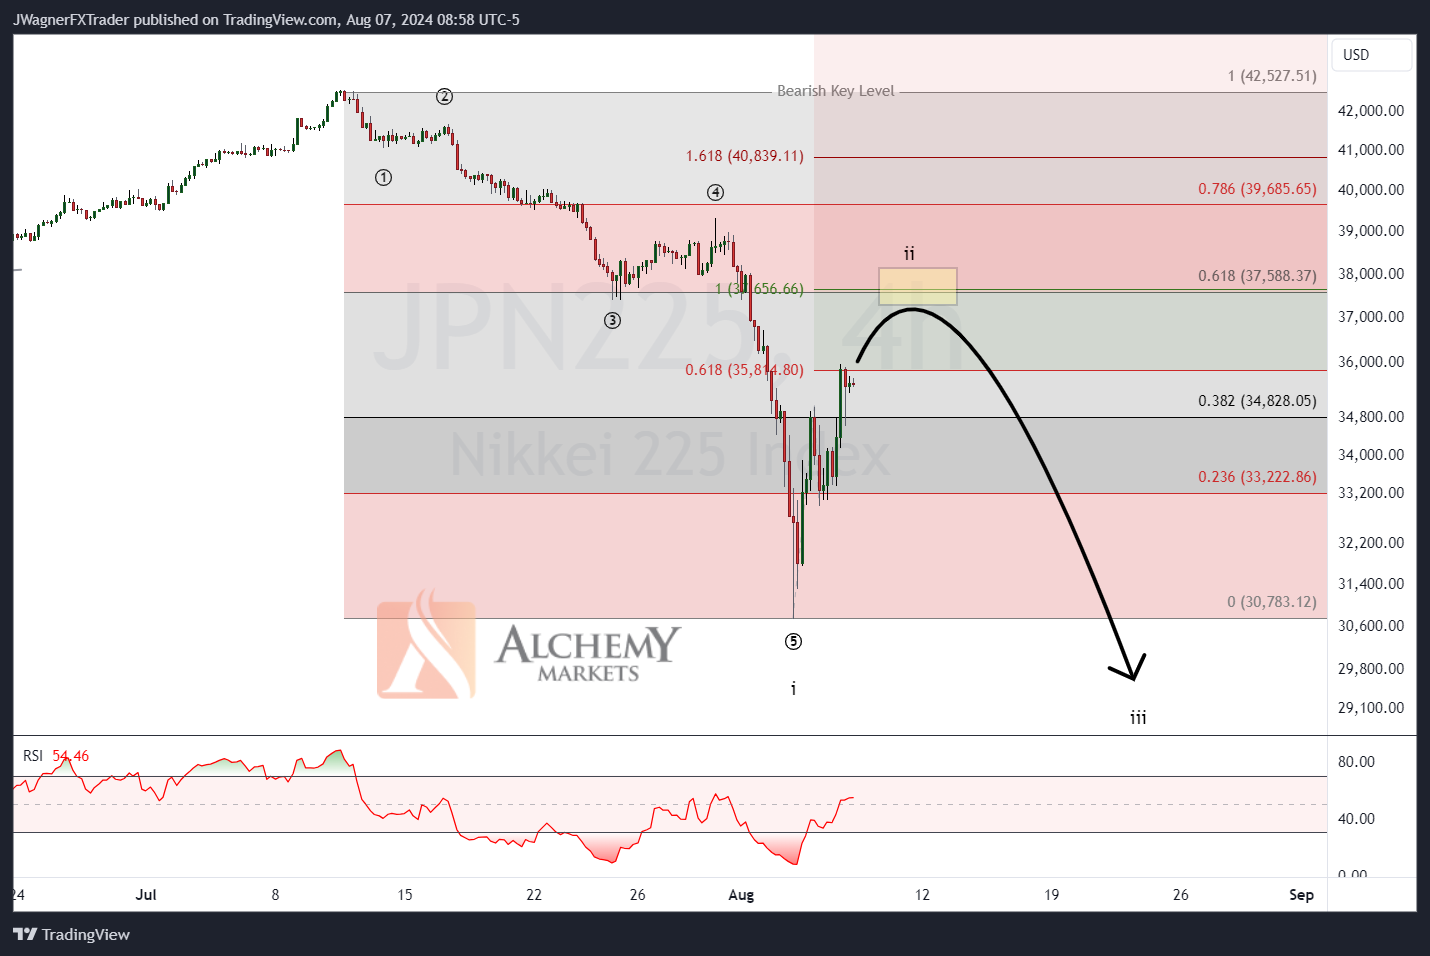
Dialling in to the 4-hour chart, it appears a smaller degree impulse has completed this week. This may drive Nikkei a little higher as wave ii unfolds. This supports the development of the bullish pin bar candle.
However, wave ii is a temporary rally that may drive up to 36,600-37,600. From near that zone, anticipate sellers to re-emerge as wave iii to the downside begins to take hold.
Wave iii could drive down to 23,000-29,000.
Bottom Line
Wave ii appears to be carving to the upside. Nikkei doesn’t have to rally but there are wave relationships in the 36,600-37,600 zone that may suppress pricing.
Once the final waves of ii are in place, then the wave iii downtrend could see Nikkei decline to 23,000-29,000.
The key level for this bearish forecast is the July high of 42,555.
You might also be interested in:
Q3 Equities Forecast (SPX, NQ, DJIA, FTSE, DAX)


