


- Elliott Wave
- September 18, 2024
- 2 min read
Gold’s Shiny Days Dimming [Gold Elliott Wave]
Executive Summary
- Gold’s near-term uptrend appears over
- Gold has carved the minimum waves to consider wave ((iii)) complete
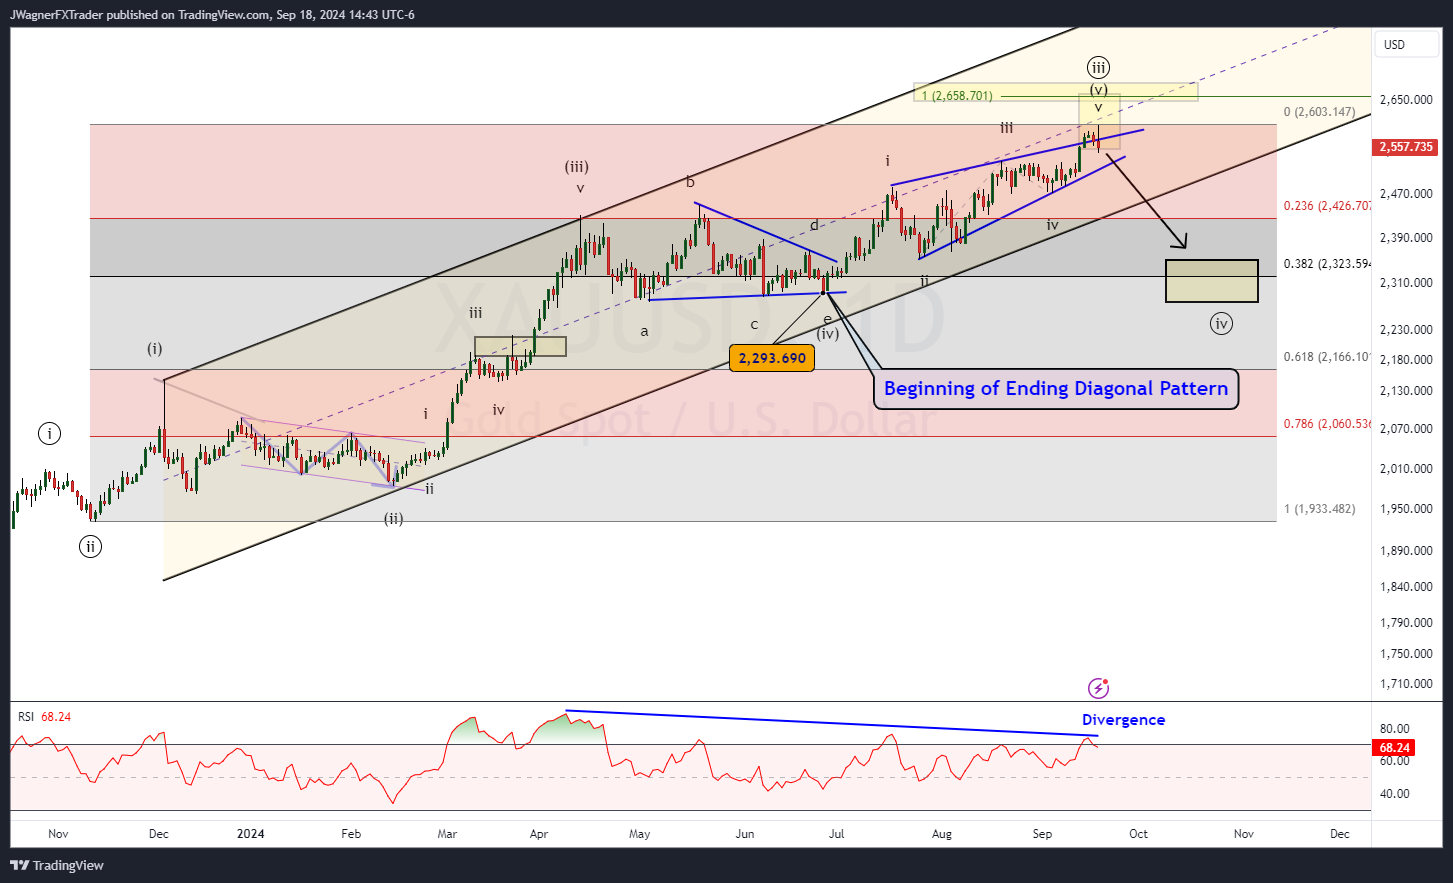
- The next wave, wave ((iv)), is a bearish trend that may slide down to $2293-$2323
Gold Shows Topping Symptoms
Gold has been shining bright since the beginning of 2024. However, this bright shine may lose a little lustre in the coming weeks.
The minimum waves are in place to consider the wave ((iii)) complete. This means a decline in wave ((iv)) may be underway. The bearish RSI divergence between the highs of wave (iii) and (v) also suggest a loss of momentum and potential bearish turn.
A lot of market participants would point to the Fed’s 50 basis point rate cut earlier today as the catalyst for the decline. However, using Elliott wave as our guide, we set a price target of $2516-$2621 in our Elliott wave gold forecast on July 12. Today, gold briefly touched a high of $2600, then violently reversed.
Gold’s Current Elliott Wave Count
The current Elliott wave count is that wave ((iii)) has just ended and wave ((iv)) is just beginning to trend lower.
The sloppy and overlapping advance from June 26 to September 18 provides the look and feel of an Elliott wave ending diagonal pattern. Therefore, we are counting wave (v) of ((iii)) as the ending diagonal.
The price action from today carved a shooting star candlestick pattern. The brief punch to a new high followed by an abrupt decline gives the shooting star pattern its shape.
There are a couple of wave relationships we can use to build a target zone for wave ((iv)).
First, we can anticipate the entire ending diagonal pattern to be retraced. The ending diagonal began after the symmetrical triangle ended at $2293.
Additionally, the 38% Fibonacci retracement of the entire wave ((iii)) advance crosses near $2323. Therefore, we can establish a potential wave ((iv)) target zone of $2293-$2323.
Bottom Line
It appears gold completed its wave ((iii)) and wave ((iv)) is beginning to trend down to $2293-$2323.
Fourth waves can take on a myriad of shapes, but it is expected to last several weeks.
If gold prices turn higher and move above today’s high of $2600, then we’ll re-evaluate if wave ((iii)) is finished.
You might also be interested in:
Crude Oil Downtrend Set to Spill Further (Elliott Wave)
Cable’s Climb is Pound-ing the Dollar (Elliott Wave)


