- Elliott Wave
- September 24, 2025
- 2 min read
Gold’s Recent High is Diverging (Elliott Wave)
Executive Summary
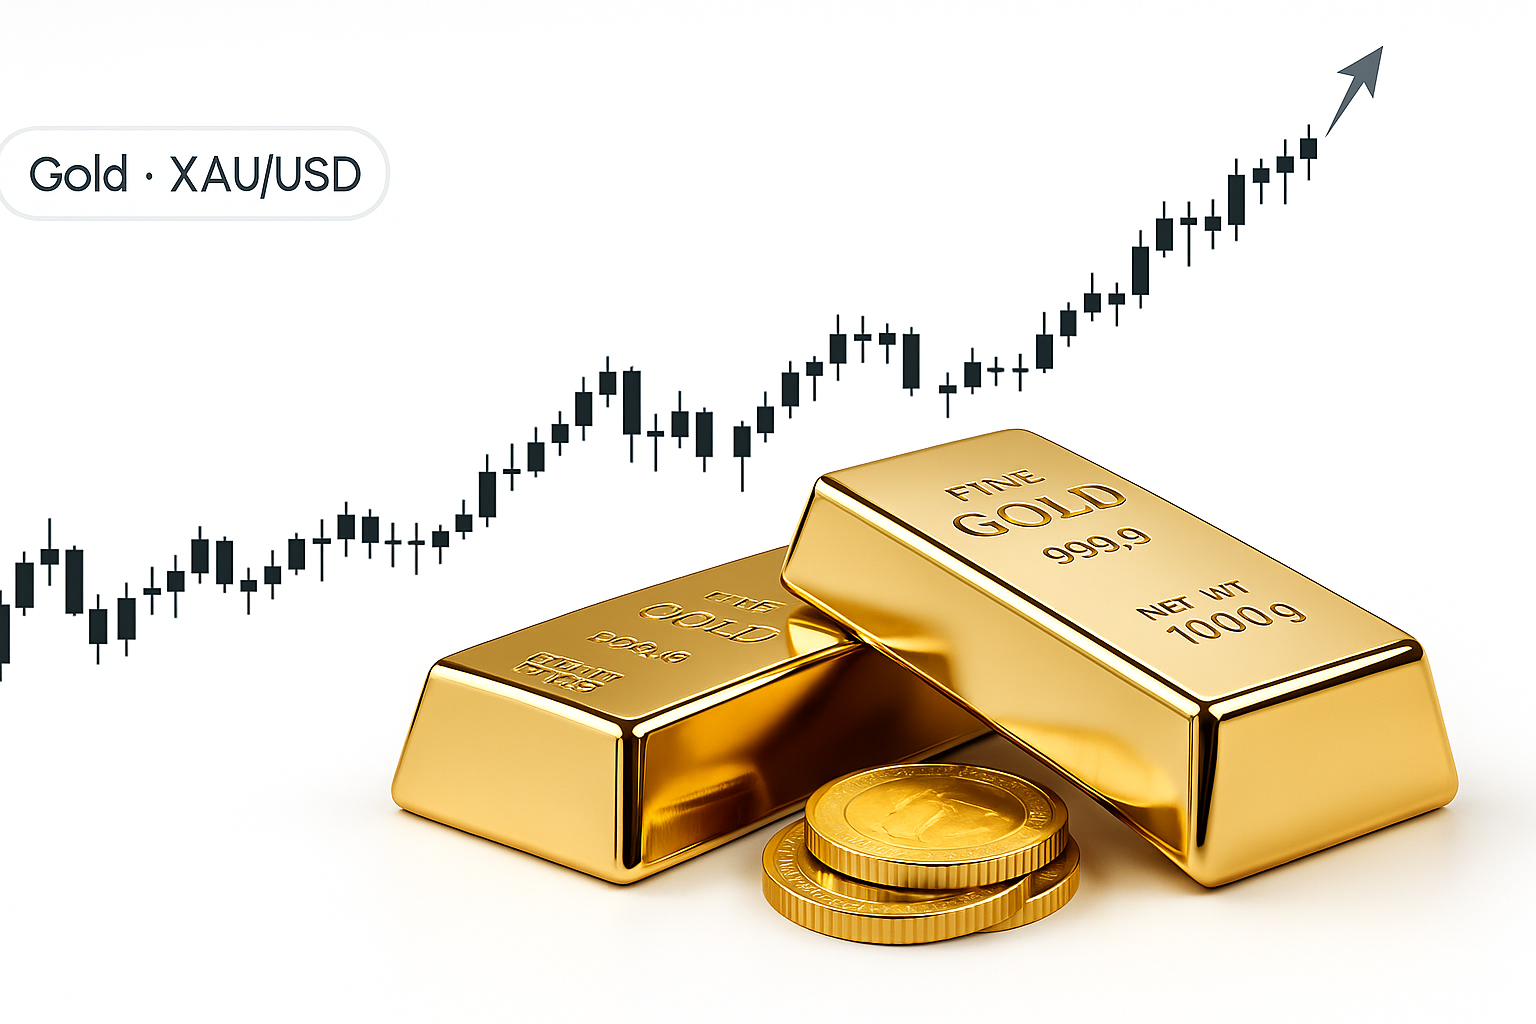
- Trend Bias: Gold (XAUUSD) has been rallying higher in wave 3 of (5) after a triangle break.
- Key Levels: Support zones to watch include $3,608.
- Watch for 5 waves to unfold to the upside.
Current Elliott Wave Analysis
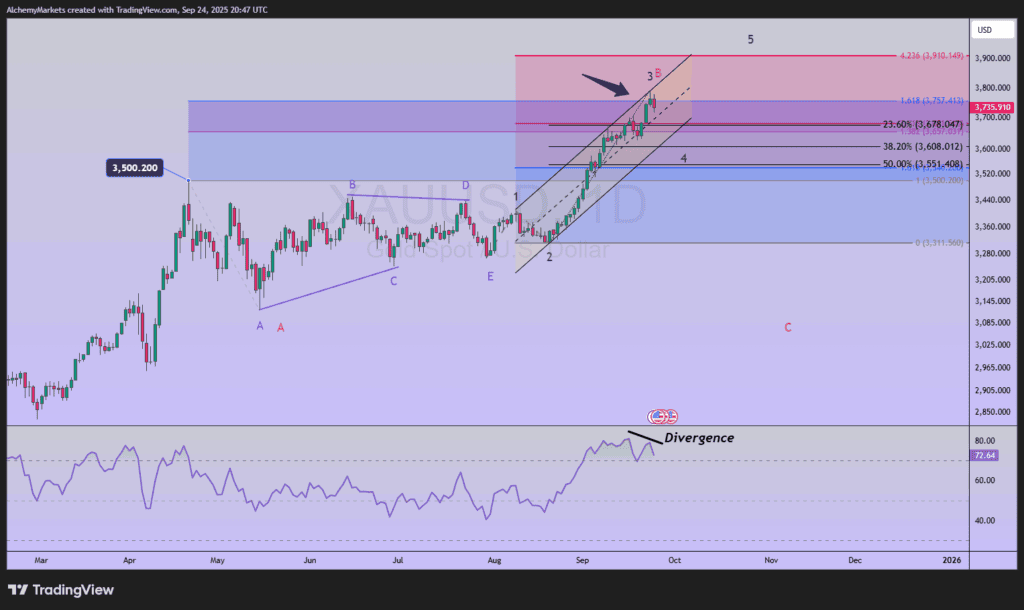
Gold has continued its strong rally and appears to be wave 3 of (5). It is possible that wave 3 is topping soon as RSI divergence is appearing. If this is correct, then wave 4 of (5) would be a minor dip to $3,608 – $3,678.
This price zone is a typical decline in Elliott wave for wave 4 when wave 3 is extended. The zone is generated by using the Fibonacci retracement tool and mapping off 23.6 to 38.2%.
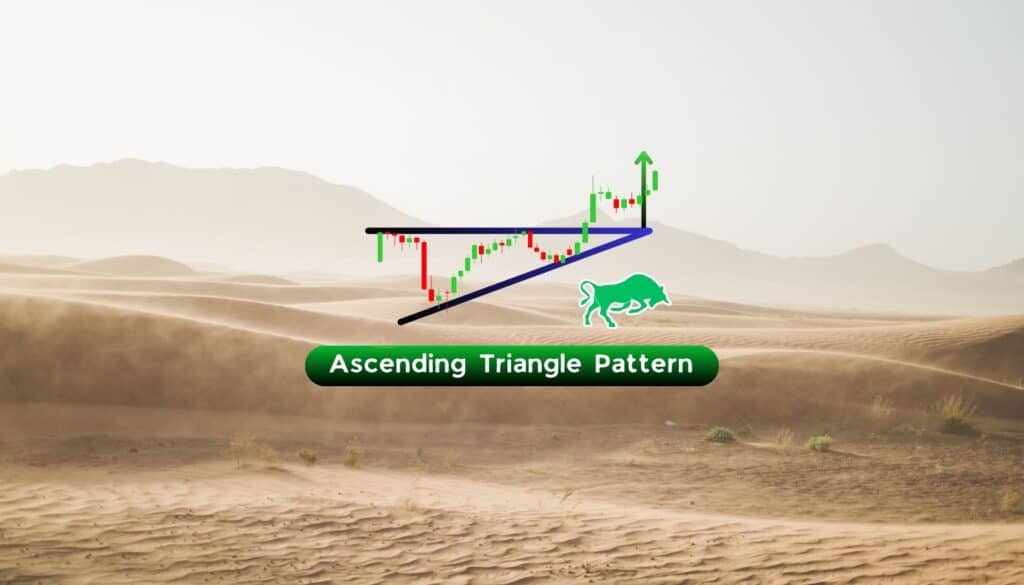
For most of Q2 2025, gold marched sideways in an ascending triangle that ended on July 30 that then led to this rally.
There is an alternate count we are considering. If gold declines below $3,608, then yesterday’s high could be wave B of a larger triangle pattern. This would imply a decline to near $3,300 in choppy fashion. The triangle would drag on for another 6-9 months leading into Q2 2026.
Bottom Line
Gold appears to be near the end of wave 3 of (5). If correct, then a decline in wave 4 would be temporary and possibly reach support $3,608. Once wave 4 is complete, then a retest to new all-time highs in wave 5.
If gold keeps accelerating higher, then wave 3 is extending higher.
If gold falls below $3,608, then we’ll consider an alternative count that implies a much larger scale triangle pattern in the works.