


- Elliott Wave
- March 6, 2025
- 3 min read
EUR/USD Elliott Wave: Middle of 3rd Wave Rally
Executive Summary
- Current Trend Bias: Wave 3 major rally.
- Key Levels: Trend line resistance near 1.0850-1.0900; wave relationship support above 1.065.
- Forecast Implication: Though EURUSD reached trend line resistance, we anticipate a break above after a brief pullback.
Current Elliott Wave Analysis
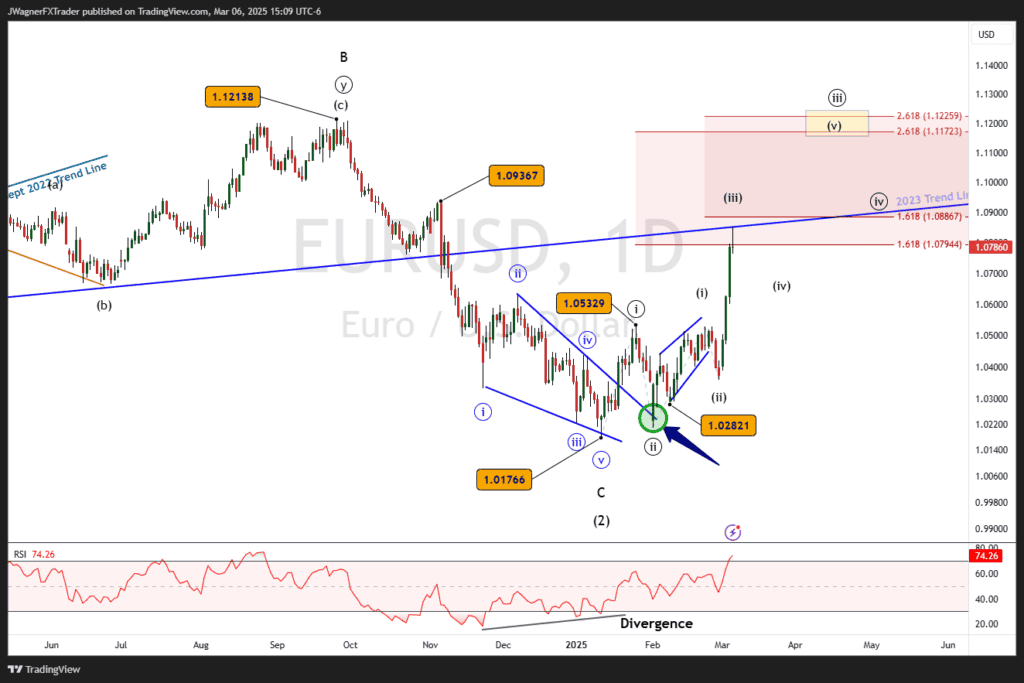
The EUR/USD daily chart shows a multi-degree Elliott wave bullish structure unfolding. At the higher degree, the chart shows a strong advance this week as EURUSD climbs the middle of wave ((iii)). The lower degree trend is also in a third wave. When multiple degrees of trend align into a 3rd wave, a powerful trend unfolds.
This is how we are able to make forecasts in EURUSD like what transpired on February 7 when we stated:
“EUR/USD is in the latter stages of a corrective Wave 2. While further downside may test the 1.02590–1.0298 support zone, a significant bullish reversal is anticipated.”
“Bearish Dip; Bullish Lift” – February 7, 2025
On February 10, EURUSD bottomed at 1.0282, right inside the target zone and has lifted significantly higher since. Not all forecasts work out like this, but Elliott wave does provide a framework to analyze the mini-trends to see what larger patterns are unfolding.
EURUSD Elliott Wave Forecast
There are two factors pointing to a minor pullback near current prices.
First, the bottom side of a former support trend line dates back to 2023 is crossing in the 1.0850-1.0900 price zone. Additionally, a Fibonacci extension of wave (iii) rests near 1.0887.
This suggests that wave (iv) of ((iii)) may begin soon and grind sideways to lower. EURUSD are likely to hold above 1.0650 prior to another advance in wave (v) of ((iii)).
One guideline of Elliott wave is alternation between waves (ii) and (iv). Since wave (ii) was a sharp zigzag, wave (iv) is likely to be a sideways flat or triangle pattern.
If this forecast is correct, then a wave (v) of ((iii)) rally may lose momentum near 1.12 as this price zone is where a previous swing high from 2024 rests plus 2.618 times the length of wave ((i)).
Bottom Line
EUR/USD is in the middle stages of a bullish wave ((iii)) rally. Price may find subtle resistance near current highs. Any corrective dips likely hold above 1.0650 as momentum gathers to break above the resistance trend line.
The next rally may carry up to 1.12 where a larger battle between the bulls and bears is likely to be fought.
Though not expected, a breakdown below 1.0650 would be a cause for concern to elevate alternate scenarios.
You Might Be Interested In:


