- Elliott Wave
- January 16, 2025
- 3 min read
EUR/USD Elliott Wave: Falling Wedge at Bull’s Edge
Executive Summary
- The Elliott wave analysis for EUR/USD suggests a large important bottom appearing between 1.0177 and 1.0035.
- We illustrate two counts below, the bottom might be in place on January 13 or at slightly lower levels.
- If this is correct, then the next bull run may carry EUR/USD up +1000-2000 pips.
Current Elliott Wave Analysis
EUR/USD is in the final wave at multiple degrees of downtrend. This means a bullish reversal is likely around the corner, if the bottom hasn’t already formed on Monday, January 13.
This next rally should last several months and carry EUR/USD above 1.12 and possibly to 1.20.
We forecasted in our November 27 post that EURUSD was likely going to rally to 1.0610-1.0670, then reverse lower to 1.0220-1.0270.
On December 6, EURUSD rallied to a high of 1.0629 and has since fallen to a low of 1.0177 this past Monday, January 13.
We are unsure if 1.0177 is the final low, but if it isn’t the final low, EURUSD is getting very close.
Let’s review a couple of wave counts we are following that are quite similar and call for a bullish reversal.
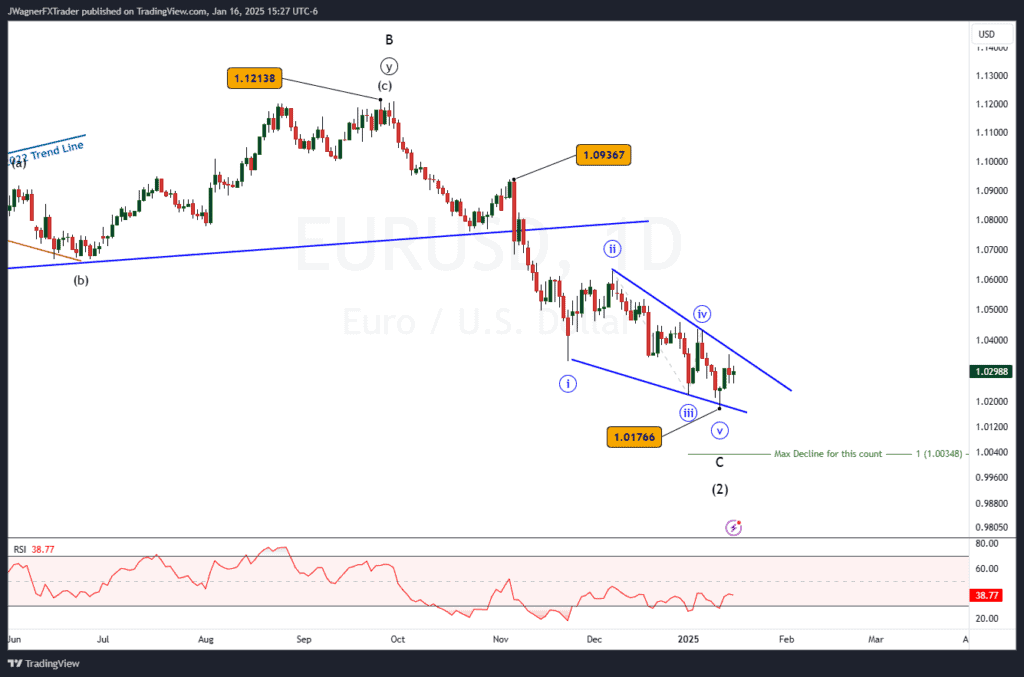
Wave C Ending Diagonal

The sloppy and overlapping pattern does hint that an ending diagonal of some form is taking shape. This first pattern places the Ending Diagonal within Wave C of a larger corrective (2) wave:
- Wave C contains 5 subwaves.
- The minimum waves are in place to consider this pattern complete at the January 13 low of 1.0177.
- One more low below 1.0177 is allowed, but the maximum decline allowed by this pattern is down to 1.0035
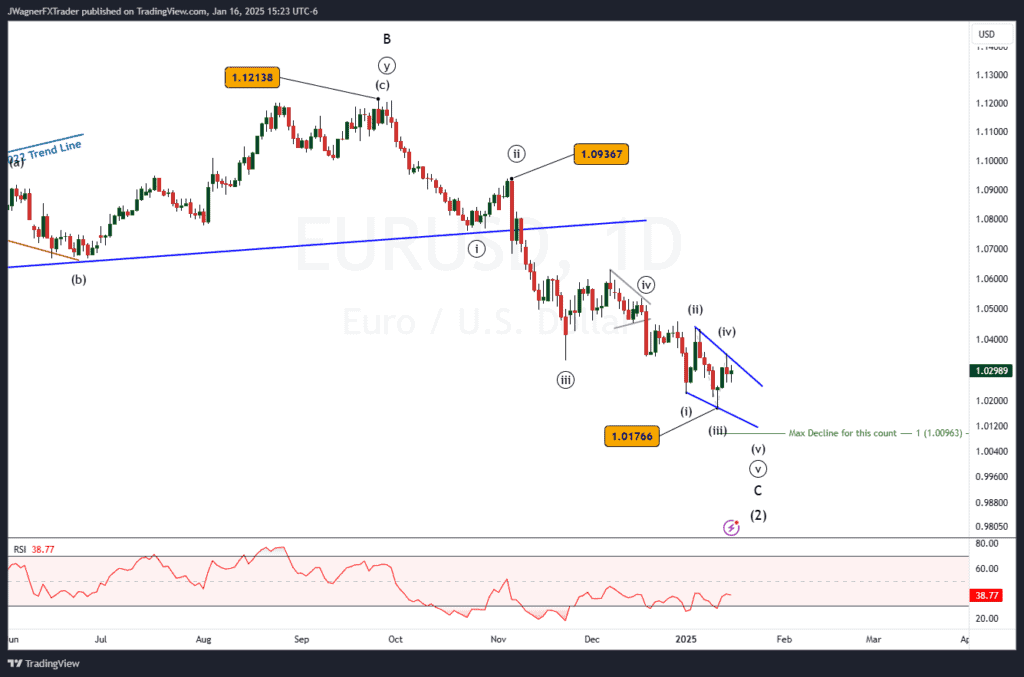
Wave 5 Ending Diagonal

A secondary and more niche Elliott wave count places an ending diagonal pattern with wave ((v)) of C. This is a smaller pattern than the count noted above. As a result, it’s levels will be a bit tighter. Key details include:
- Wave C is taking the shape of an impulse pattern
- Wave ((iv)) of C is a symmetrical triangle.
- Wave ((v)) of C is an ending diagonal pattern.
- This pattern requires one more low below 1.0177, but the price must hold above 1.0096 or else an Elliott rule is broken.
Similarities and Differences
- Similarities: Both scenarios illustrate EURUSD declining in wave C of a flat pattern. Additionally, both scenarios call for a major low between 1.0035-1.0177. Once the bottom is in place, both scenarios forecast a large bullish trend. The RSI bullish divergence signals a bullish reversal soon.
- Differences: The falling wedge as wave C provides a wider target range and its possible that January 13 is the end. The falling wedge as wave ((v)) requires one more dip that must hold above 1.0096.
Bottom Line
Both the primary and alternate counts suggest a major low forms in EURUSD between 1.0035-1.0177. Once the major low is in place, then a rally lasting several months is likely to carry EURUSD above 1.12 and possibly to 1.20.
A break above either blue resistance trend line would build the case that the major low is in place. Additionally evidence of a bottom in place is when price passes wave ((iv)).
You Might Be Interested In:


