- Elliott Wave
- January 13, 2025
- 2 min read
AUD/USD Elliott Wave: Bears in Control, But a Reversal Looms?
Executive Summary
- Trend Bias: The AUD/USD pair is in a downtrend, in the process of completing a five-wave decline.
- Initial Target: The 1.618 Fibonacci extension near 0.6058 is a target zone for wave ((iii)).
- Resistance to Watch: Above .6500 would be too large of a rally to consider a wave (iv) or wave ((iv)).
Current Elliott Wave Analysis

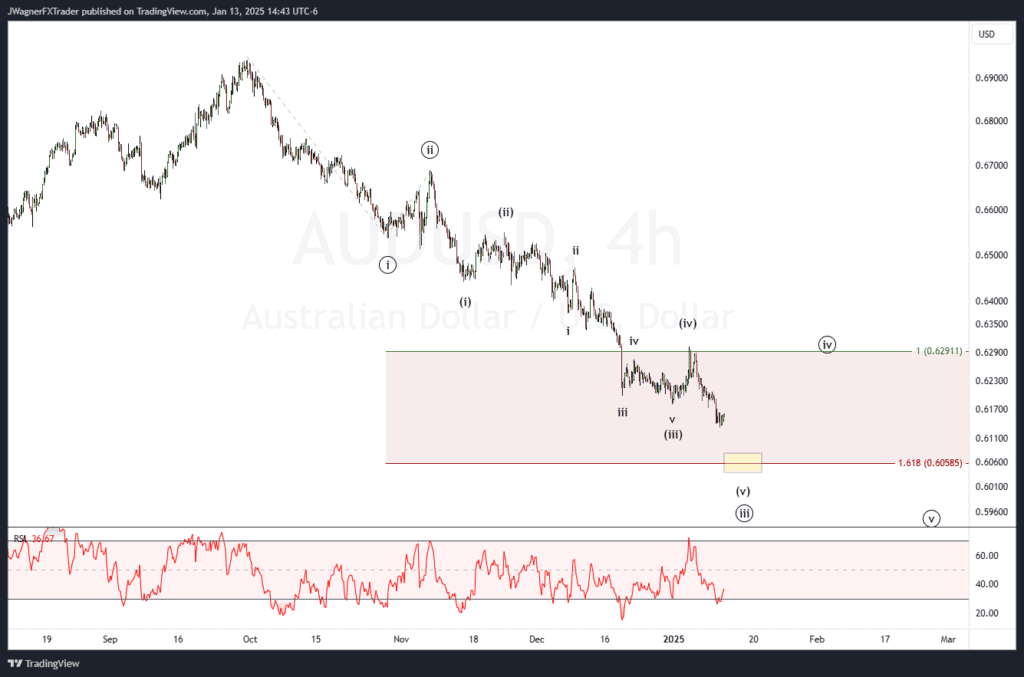
The 4-hour AUD/USD chart indicates the current Elliott wave count is wave (v) of ((iii)). Aussie is approaching the final stages of wave ((iii)) that, when completed, will invite the largest rally since the early November rally.
The soft target for wave (v) of ((iii)) is .6058, where wave ((iii)) is 1.618 times the length of wave ((i)). This is a common target level for a third wave using the Fibonacci extension tool.
The downward momentum remains strong, but wave (v) of ((iii)) could be nearing exhaustion. The RSI indicator is in oversold territory, hinting at a possible bottoming process. This aligns with the Fibonacci projection, a common reversal zone for terminal waves.
Once wave ((iii)) is complete, then we’ll anticipate a rally in wave ((iv)) to carry back up near .6300 and the other previous fourth wave highs. We can fine tune the target for a wave ((iv)) rally by applying the 38.2% Fibonacci retracement tool for wave ((iii)) once it is completed.
Bottom Line
We’ve been anticipating a decline for Aussie in Q1 2025. AUD/USD remains in a clear bearish trend, with wave (v) of ((iii)) likely heading toward the 0.6058 region. However, oversold conditions suggest that traders should watch for potential reversal signs near this level. A corrective rally could push the price towards 0.6291, but a break above that is needed to confirm a larger recovery.
You might also be interested in…


