


Written by:

- Chart of the Day
- Opening Bell
- June 29, 2026
- 3 min read
WTI Crude Oil — Channel Floor, Deep Fib, Divergence
WTI crude has been in freefall for most of the past three months, but the price action over the last few sessions is starting to raise a question worth asking: is the selling pressure finally running out of road?
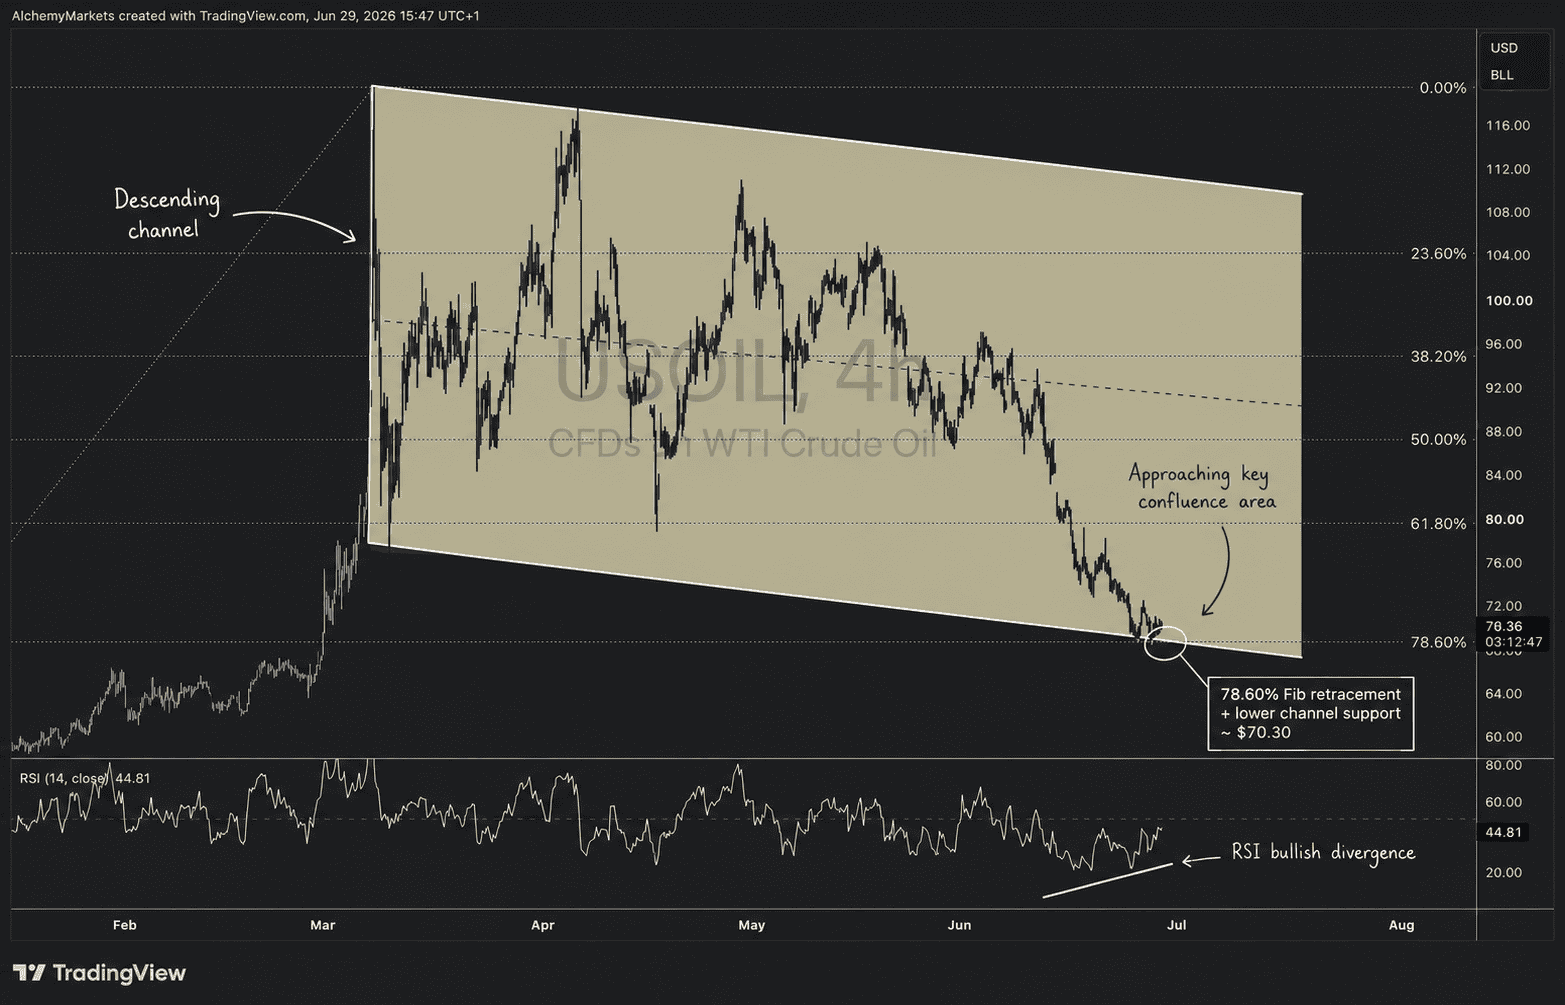
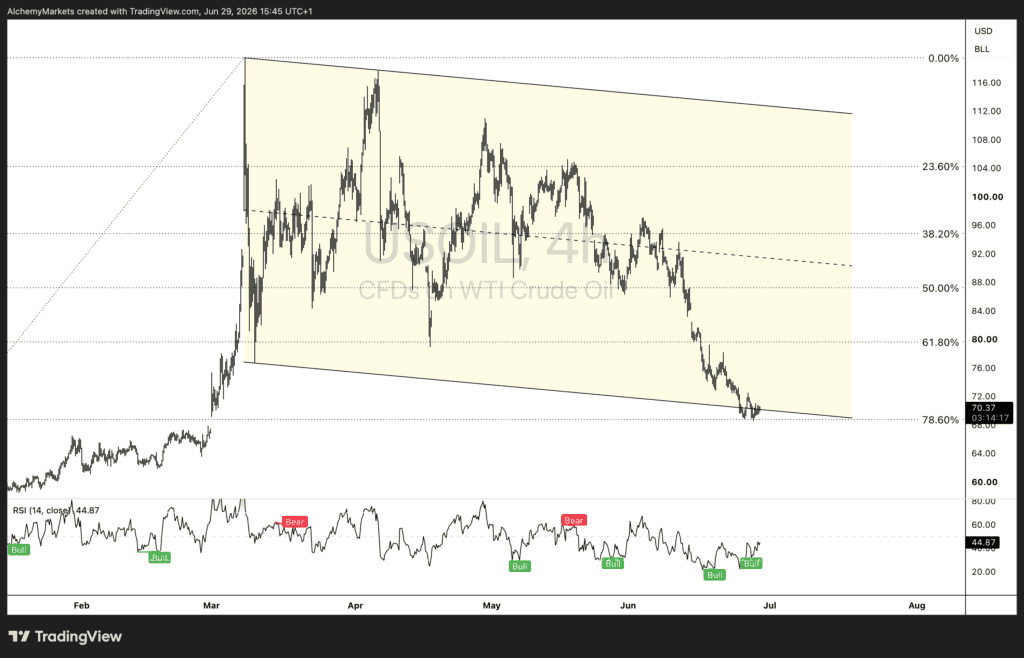
The 4-hour chart tells a fairly clear structural story. From the March highs, price has been grinding lower inside a well-defined descending channel — a series of lower highs, lower lows, and a consistent slope that has capped every attempted recovery. That channel has governed the price for the better part of four months, and for most of that time, there was no real reason to argue against it.
That changes somewhat at current levels.
78.6% Fib — The Deep End of the Pool
Using the full leg from the March swing high down to the pre-channel base, price has now retraced all the way to the 78.6% Fibonacci level — sitting right around the $70 area. That is not a shallow pullback or a mid-range consolidation. A 78.6% retracement is a deep correction by any standard, the kind that tends to either mark exhaustion in the prevailing move or precede an outright trend continuation through the low. The level itself carries weight precisely because it is the last credible Fibonacci defence before the full move is erased.
The fact that price has stalled and begun to hover in this zone is worth noting. It has not broken cleanly through it yet.
Lower Bound of the Channel
Compounding the significance of the Fibonacci level is where it sits structurally. The 78.6% retracement is not just a number on the chart — it is landing almost exactly on the lower boundary of the descending channel. That convergence matters. Price is now pressing into a zone where two separate technical frameworks are pointing to the same area as meaningful support. Confluences of this kind tend to attract reactions, even within broader downtrends.
The channel floor has not been breached on a closing basis, which keeps the structure intact for now.
RSI Divergence — Momentum Fading
What makes the setup more interesting is what the RSI is doing. Across the sequence of recent lows, price has continued to make lower lows, but the RSI has been forming higher lows — classic bullish divergence. The indicator is currently sitting at 44.68, nowhere near oversold in the traditional sense, but the divergence pattern has been building across multiple touches and is visible across the chart’s prior bounce points as well.
Divergence alone does not reverse a trend. What it does is signal that downside momentum is losing conviction. The sellers are still pushing price lower, but each successive push is requiring less energy to sustain — and that is precisely the kind of condition that precedes a shift in the balance of pressure.
The Setup, Not the Signal
To be direct about where things stand: this is a setup, not a confirmed signal. Price is sitting in a technically significant zone, momentum is diverging, and the structure is at a decision point. But there is no confirmation yet. A meaningful bounce from current levels — one that establishes a higher low or breaks near-term structure to the upside — is what would turn this from an observation into an actionable shift.
Until that prints, the channel is still intact and the trend is still down. What the chart is suggesting is that the next move from here deserves close attention, in either direction.


