


Written by:


- Chart of the Day
- August 20, 2024
- 3 min read
Canada Winning? USDCAD Could Fall as DXY Breaks Triangle Lower
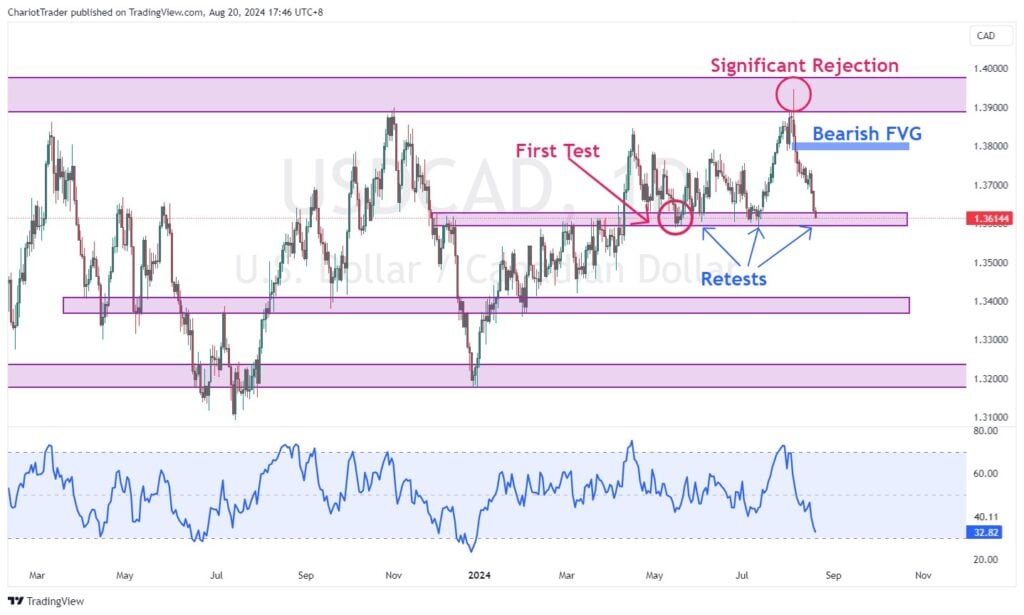
USDCAD is currently testing a significant daily support level at $1.36 CAD, marking this the fourth retest of the level. With every retest, a support level becomes weaker – so will today be the day USDCAD breaks lower?
This price action comes alongside two significant events:
- Canada will be releasing its CPI data in a few hours at 12:30PM (GMT).
- DXY has officially closed a day below a significant triangle pattern formed since July 2023, which signals weakness on the DXY and USDCAD.
Combined together, these factors may contribute to a lower USDCAD in the short term, with several key support levels to watch.
Technical Analysis of USDCAD (August 20th, 2024)
Bias: Bearish
After forming a significant rejection at $1.395, USDCAD has declined onto a significant support zone between $1.360 – $1.362 CAD. As this price zone has been retested multiple times already in the past, this results in a weaker support zone. So while a bounce is possible, our bias remains bearish.
Additionally, the relative strength index (RSI) has not reached an oversold area yet, which would suggest the price isn’t ready to drastically reverse yet.
| If this level does break lower, two support zones to watch are: • Approx. $1.337 – $1.341 CAD • Approx. $1.318 – $1.324 CAD |
| If the level does provide a bounce, two resistance zones to watch are: • Bearish Fair Value Gap (FVG) at $1.379 – $1.381 CAD • October 2022 Highs at $1.389 – $1.398 CAD |
Key Canadian CPI Data to Watch:
Furthermore, this asset may see movements today if there are any surprise readings in the CPI announcement. If the data deviates from the forecast, here’s what you can expect:
- Higher than expected: USDCAD may see a volatile rise in price
- Lower than expected: USDCAD may see a volatile price decline
| News | Previous | Forecast (Expectations) |
| CPI m/m | -0.1% | 0.4% |
| Median CPI y/y | 2.6% | 2.5% |
| Trimmed CPI y/y | 2.9% | 2.8% |
The CPI data release is scheduled for 12:30PM at GMT+0 time.
Technical Analysis of DXY (August 20th, 2024)
Bias: Bearish
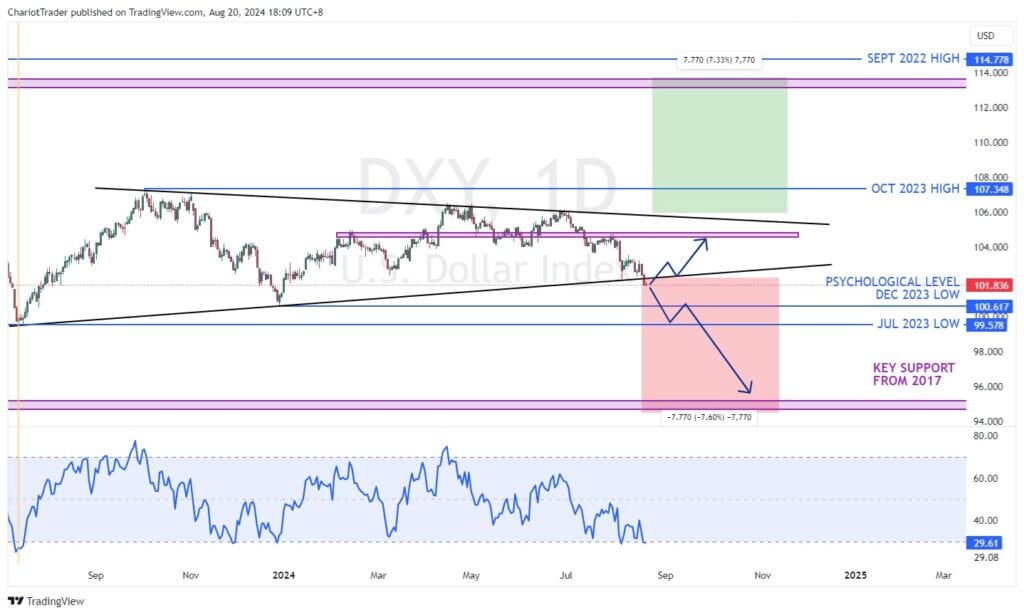
The Dollar Index (DXY) is looking like it’s in some hot water; a daily candle has definitively closed below its symmetrical triangle pattern. This threatens a significant move down with approximately 7,770 pips, according to the triangle’s measured move target.
The RSI tells a story of hope, however, as the DXY is currently oversold at 29.71, sitting below the RSI 30. If the DXY can reclaim the lower trendline of the triangle, we could potentially see a strengthening dollar in the coming days. Despite this, it is possible for the DXY to continue to fall lower.
Overall on a technical level, the DXY is looking weak and has the potential to drop towards its psychological support zone at approximately 100.000. If a decline does occur on the DXY, the USDCAD should weaken as well, supporting our projections above.
| If the DXY does break lower, the main support zones to watch are: • December 2023 Lows at 100.617 • July 2023 Lows at 99.578 • Psychological Price Level at 100.000 • Key Support from 2017 at approximately 94.714 – 95.193 |
| If the DXY does reclaim its lower trendline, two resistance zones to watch are: • Horizontal resistance at 104.569 – 104.824 • Upper trendline at approx. 105.591 |
You may also be interested in:
Tasman Sea Tussle: AUD/NZD’s Potential to Shine
Central Bank Chess: The Fed’s Next Move and Eurozone’s Economic Jitters


