


Written by:


- Chart of the Day
- July 24, 2024
- 2 min read
Temporary Dollar Strength and Potential Triangle Formation
July 24, 2024
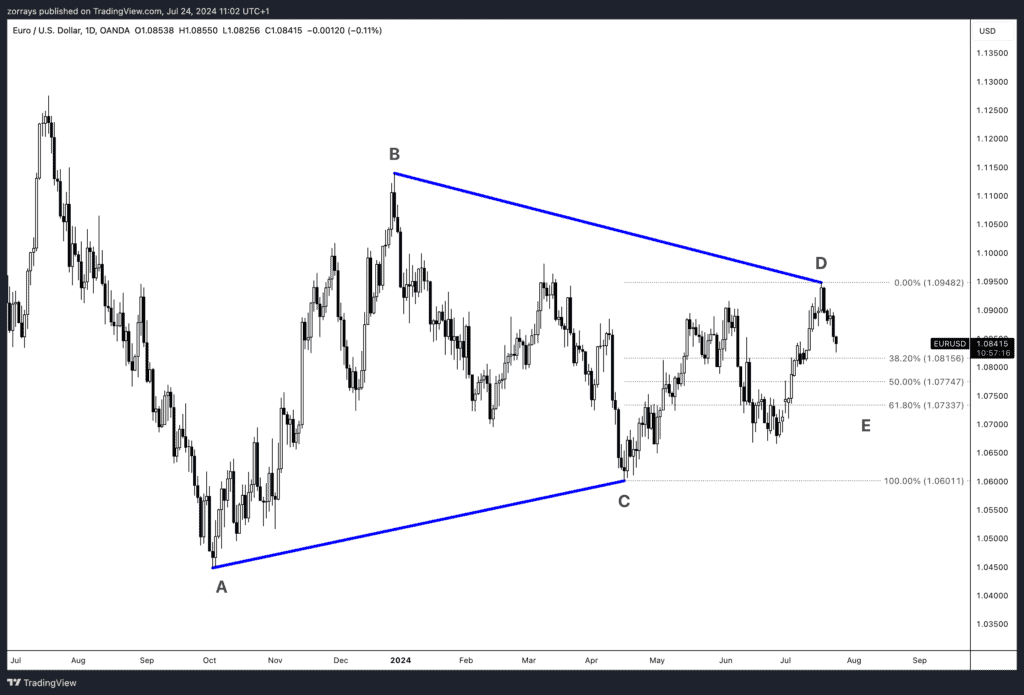
The EUR/USD pair is currently displaying an interesting technical pattern that traders should watch closely. As seen in the daily chart, there is an ongoing formation of a symmetrical triangle, with the apex near July 2023. This triangle includes several key wave movements, and we are now potentially entering Wave E.
Technical Analysis Overview
Wave E and Dollar Strength:
Recent price action suggests that the EUR/USD might experience temporary strength in the Dollar, pushing the pair lower into Wave E. This wave is expected to find support in the region between 1.081 and 1.073. This anticipated movement aligns with the typical characteristics of a triangle pattern, where price compresses towards the apex before a breakout.
Scenario Analysis:
- Bullish Continuation: Should the price hold above the 1.081 – 1.073 support zone, we could see a reversal upwards, completing the triangle formation with a subsequent bullish breakout. This scenario would align with broader expectations of Dollar weakness, especially as the Federal Reserve hints at future rate cuts.
- Bearish Continuation: Alternatively, if the support zone fails and the price breaks below the 1.073 level, the pattern could transition into a bearish triangle. This would signal a deeper retracement, potentially aligning with further economic data or policy announcements that favour a stronger Dollar.
Conclusion
For now, the EUR/USD pair should be monitored for signs of continuation towards the downside, completing Wave E. A bullish turnaround could then be anticipated as Dollar strength wanes and the market factors in potential Fed rate cuts. Keep an eye on this pair for any shifts in momentum that might indicate the end of this correction and the start of a new trend phase.
Stay tuned for further analysis, especially if bearish signals begin to dominate, which could indicate a shift in the triangle’s implications.
Key Levels to Watch:
- Support: 1.081 – 1.073
- Resistance: Previous high around 1.095
Outlook:
- Short-term: Bearish to Neutral (Wave E completion)
- Medium-term: Bullish (potential breakout post Wave E completion)
This technical pattern’s resolution will offer critical insights into the next significant move for EUR/USD, so stay vigilant and ready to adjust positions accordingly.


