


Written by:


- Chart of the Day
- April 7, 2025
- 3 min read
Fear Sweeps SPX Markets as Retail Expects Black Monday
Black Monday refers to a capitulation move that occurs on a Monday, severely bringing down stock and gold prices, with Gold being the overall winner as the safe haven (but sometimes also taking a hit).
Infamously coined in October 1987, the original “Black Monday” resulted in a -22.6% decline on the DJIA in a single day, and now the same fears are sweeping across the markets for an overwhelming bearish move.
Sentiment Signal: Searches for “Black Monday” Spike on Google
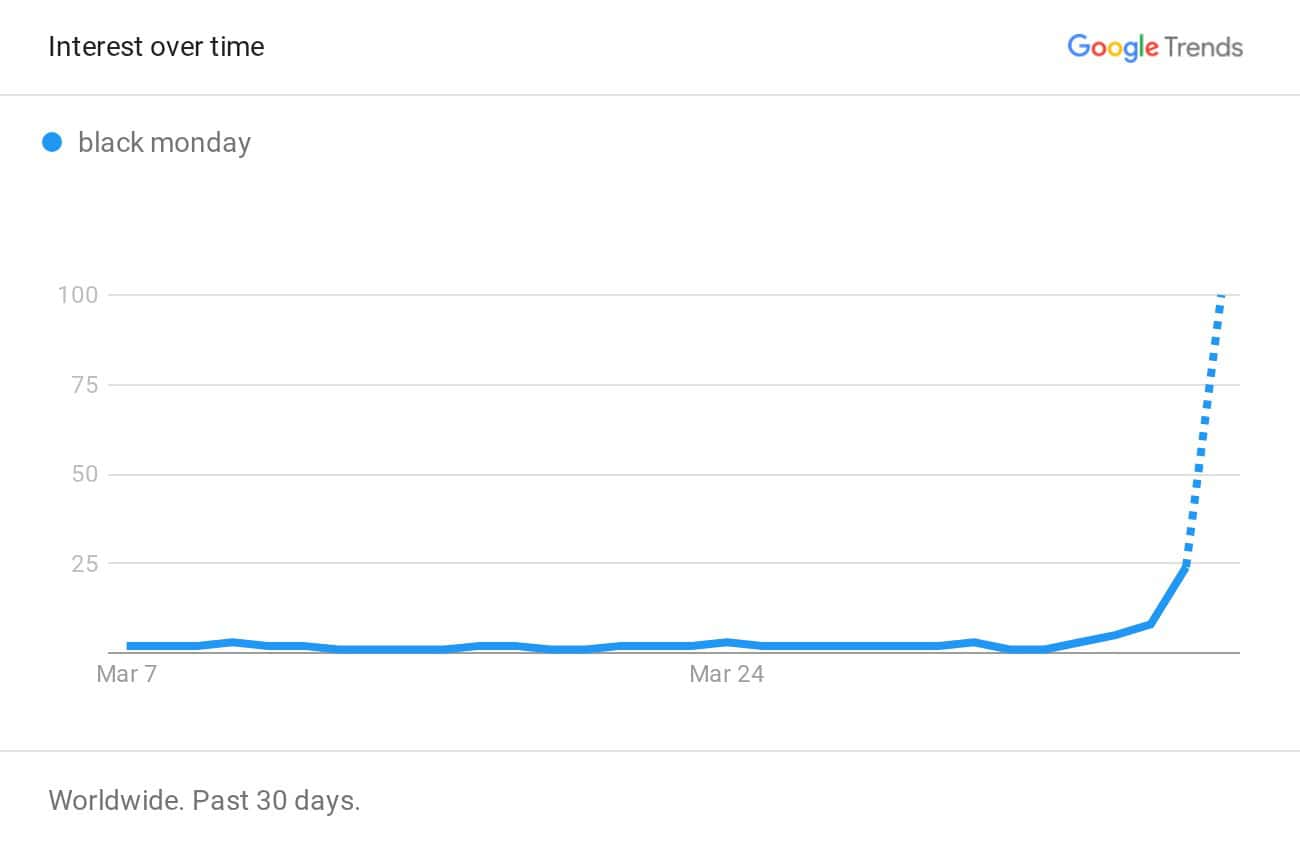
Source: Google Trends
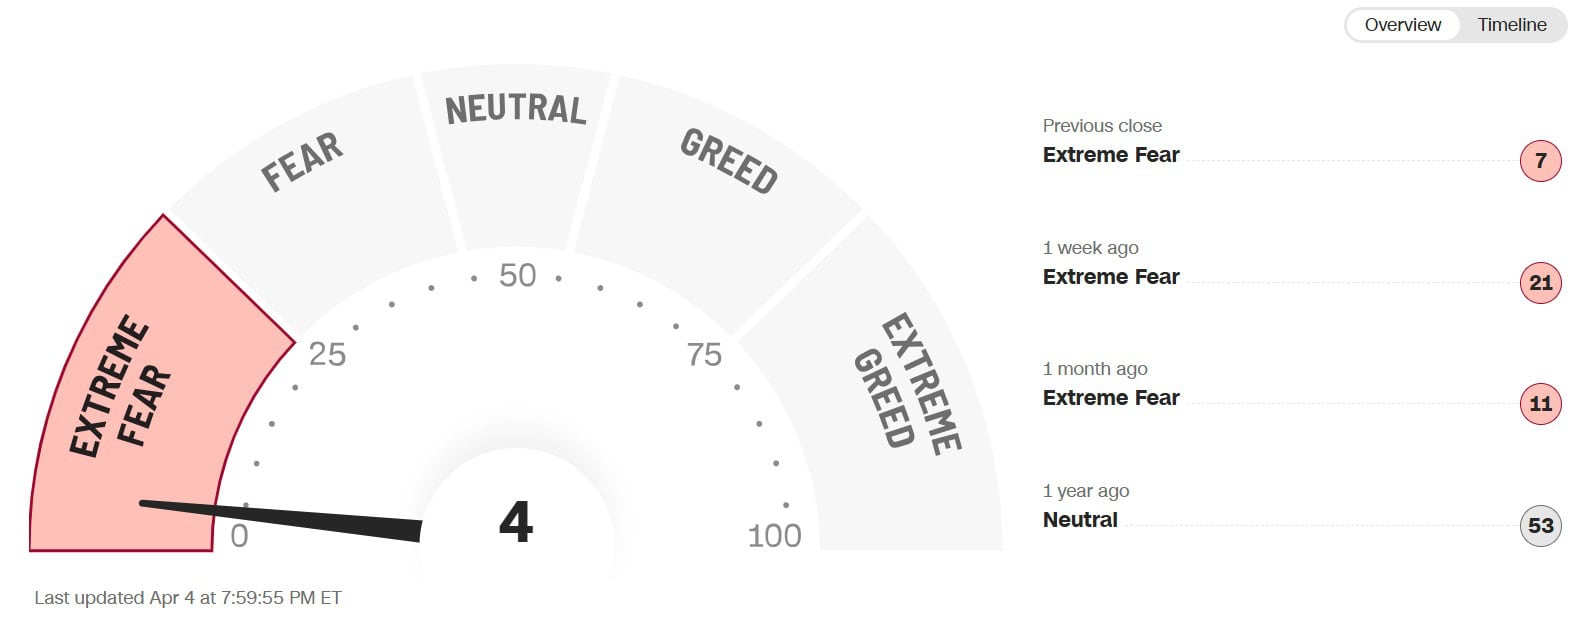
Source: CNN
Searches for the term: “Black Monday” have exploded across the weekend and today, as indicated by Google’s Trends tool. Paired with this sentiment indication is the Fear & Greed index, which has now plummeted to extreme fear readings at 4.
Part of this is due to the aggressive gap down on the S&P 500 last Friday, where the index opened lower by -1.83%, and then moved closed even lower by -4.20%.
SPX Analysis (Pre-Market Open)
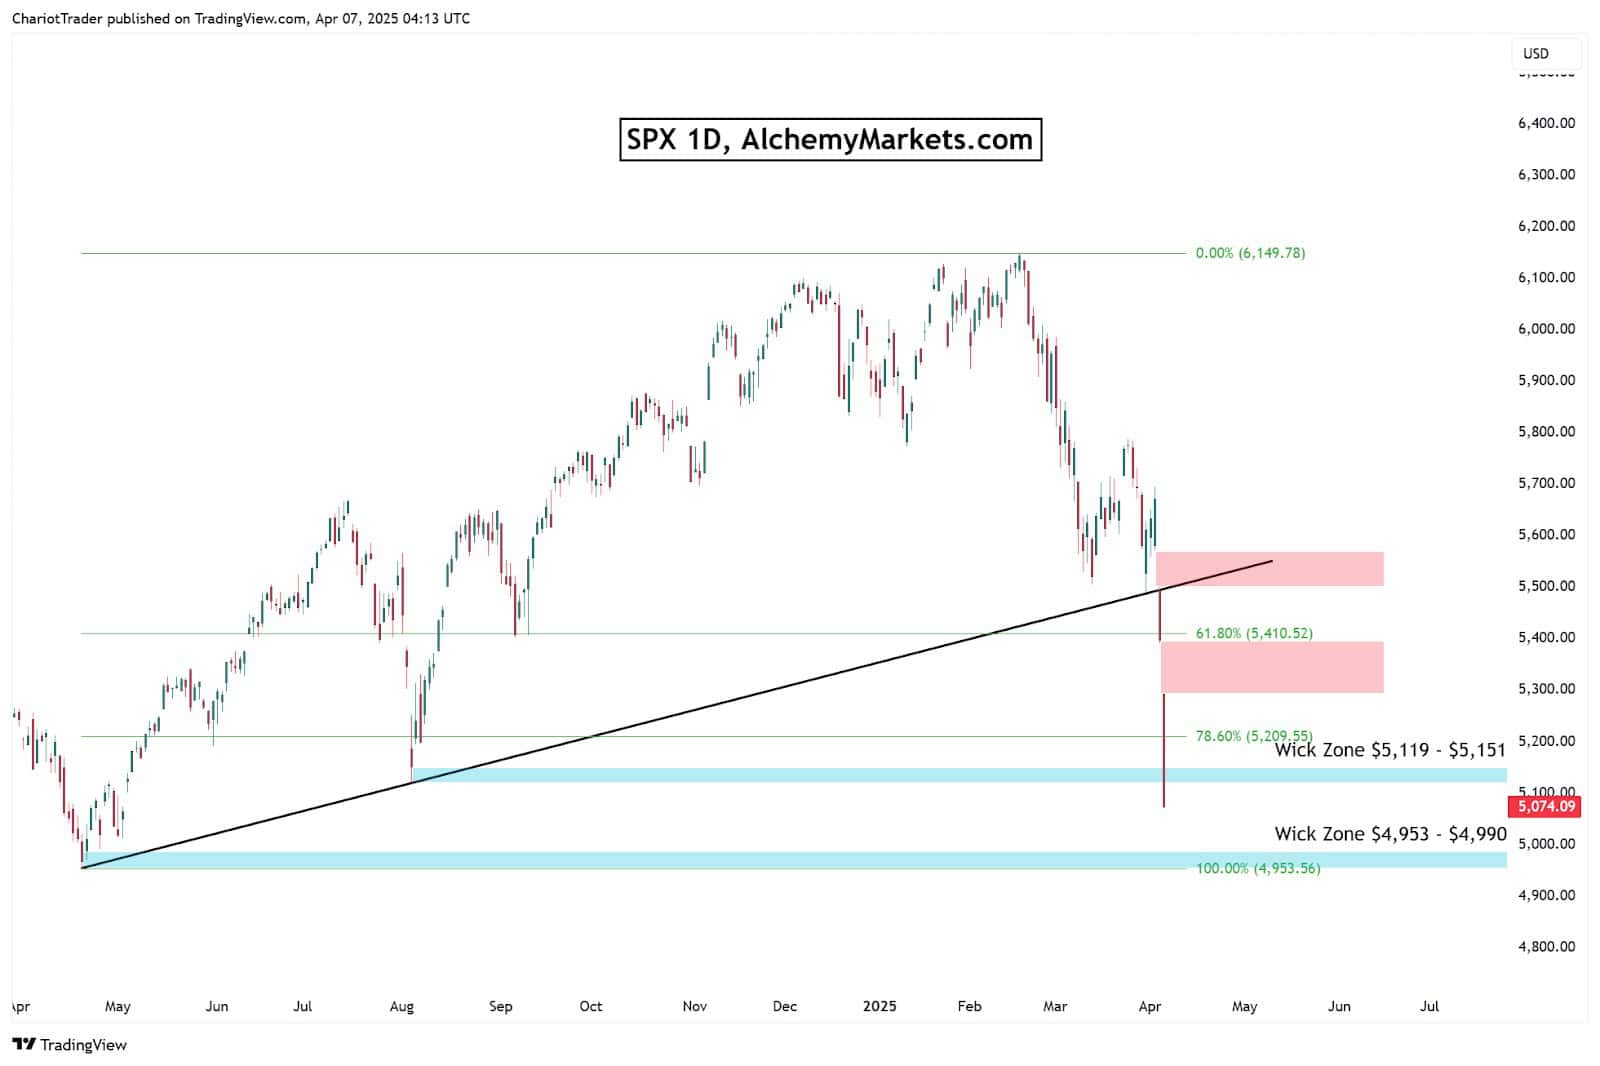
The SPX is currently in a precarious position, with the price closing a weekly candle beneath its weekly trendline, as mentioned in the previous analysis, and even chopping through critical Fibonacci support such as the 61.8% and 78.6%.
Additionally, the wick zone at $5,119–$5,151 expected to provide some relief for the SPX has been cleanly chopped through, leaving only the support at $4,953–$4,990 to champion the asset.
Where could S&P 500 find relief?
Technically, it’s possible the SPX is experiencing ABC correction, and the worst is over if we can begin to form a higher low, then a higher high above the previous high. These numbers have not yet formed in the chart, but the general concept should be kept in mind as we continue to print new daily and weekly candles.
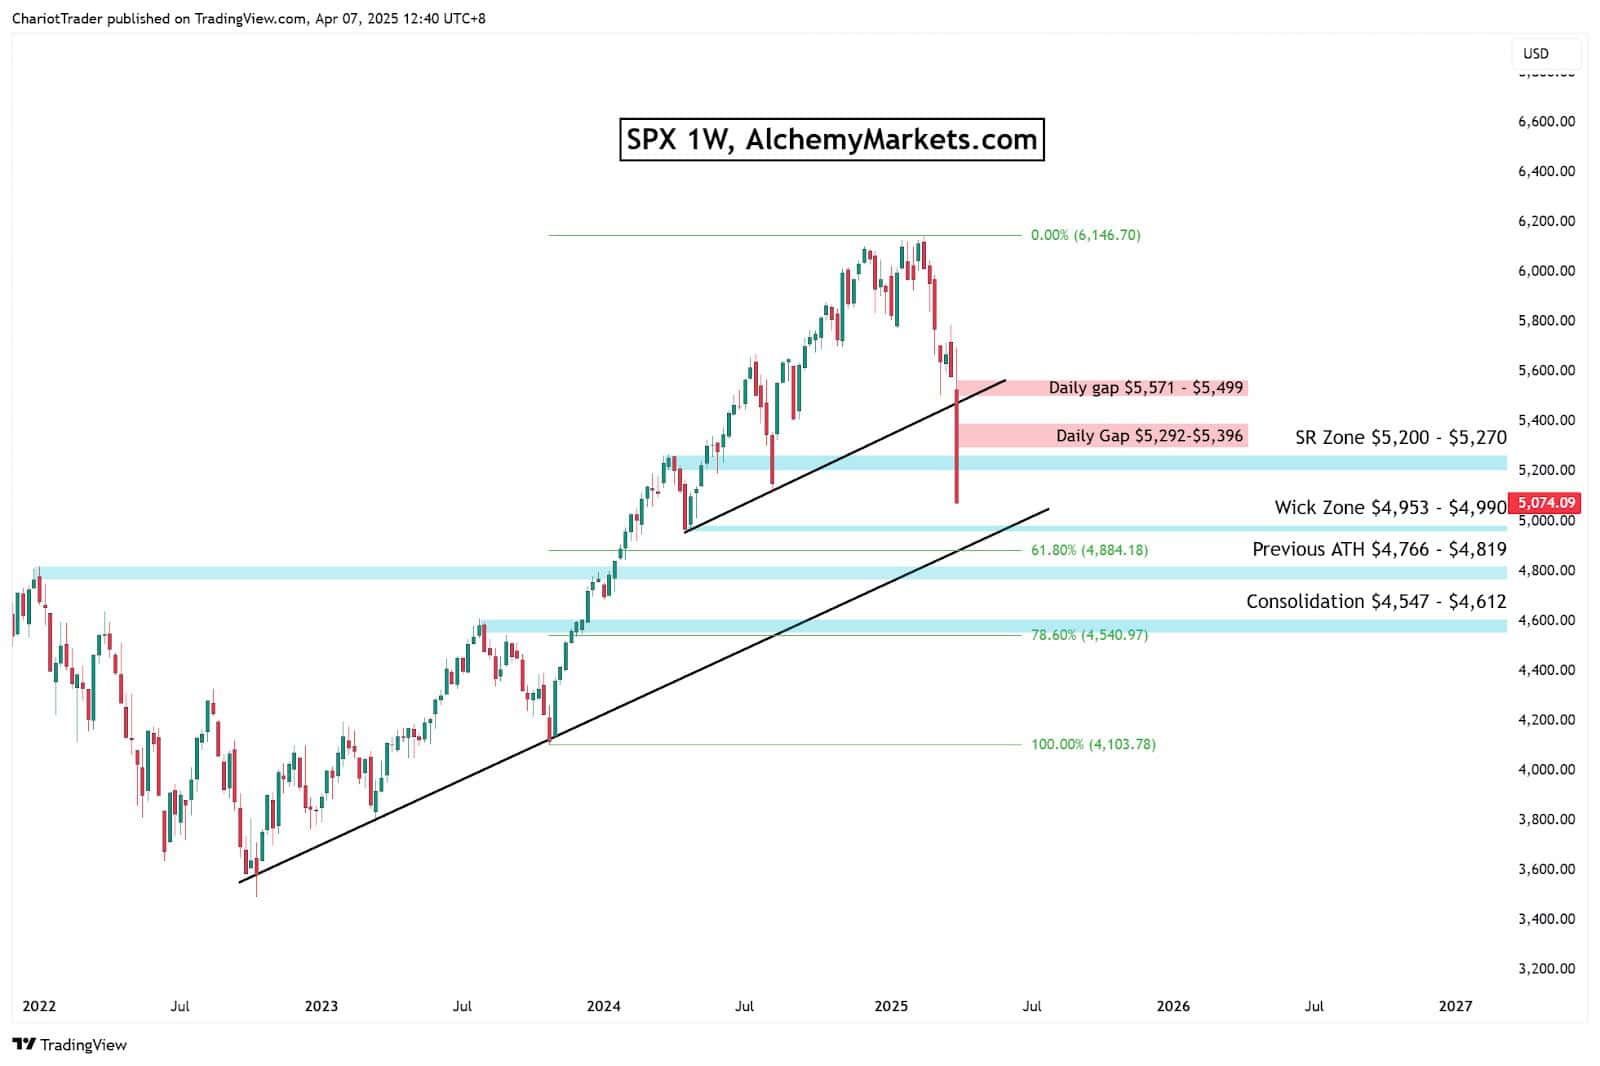
Where S&P 500 could bounce
- Wick Zone at $4,953–$4,990 (weaker zone)
- 61.8% Fibonacci at $4,884.18 (major zone, aligns with weekly trendline)
- Previous All-Time-High at $4,766 – $4,819 (major zone, aligns with weekly trendline)
Notice that the S&P 500 has a weekly trendline dating back to late 2022, which is coming into contact with the 61.8% Fib and Previous ATH.
However, due to time constraints, the wick zone is unlikely to align with the trendline if price continues to descend in coming days, so proceed with caution if you plan to open a long position there.
Despite that, SPX has Resistance Gaps to Overcome
SPX needs to overcome the daily gaps between $5,292–$5,396, then subsequently the $5,499 – $5,571 region to confirm a bullish outlook. These gaps are technical resistances that will clearly inform us of the markets’ intentions, as highlighted in our previous analysis with historical data.
You may also be interested in:


