


Written by:

- Chart of the Day
- June 23, 2025
- 3 min read
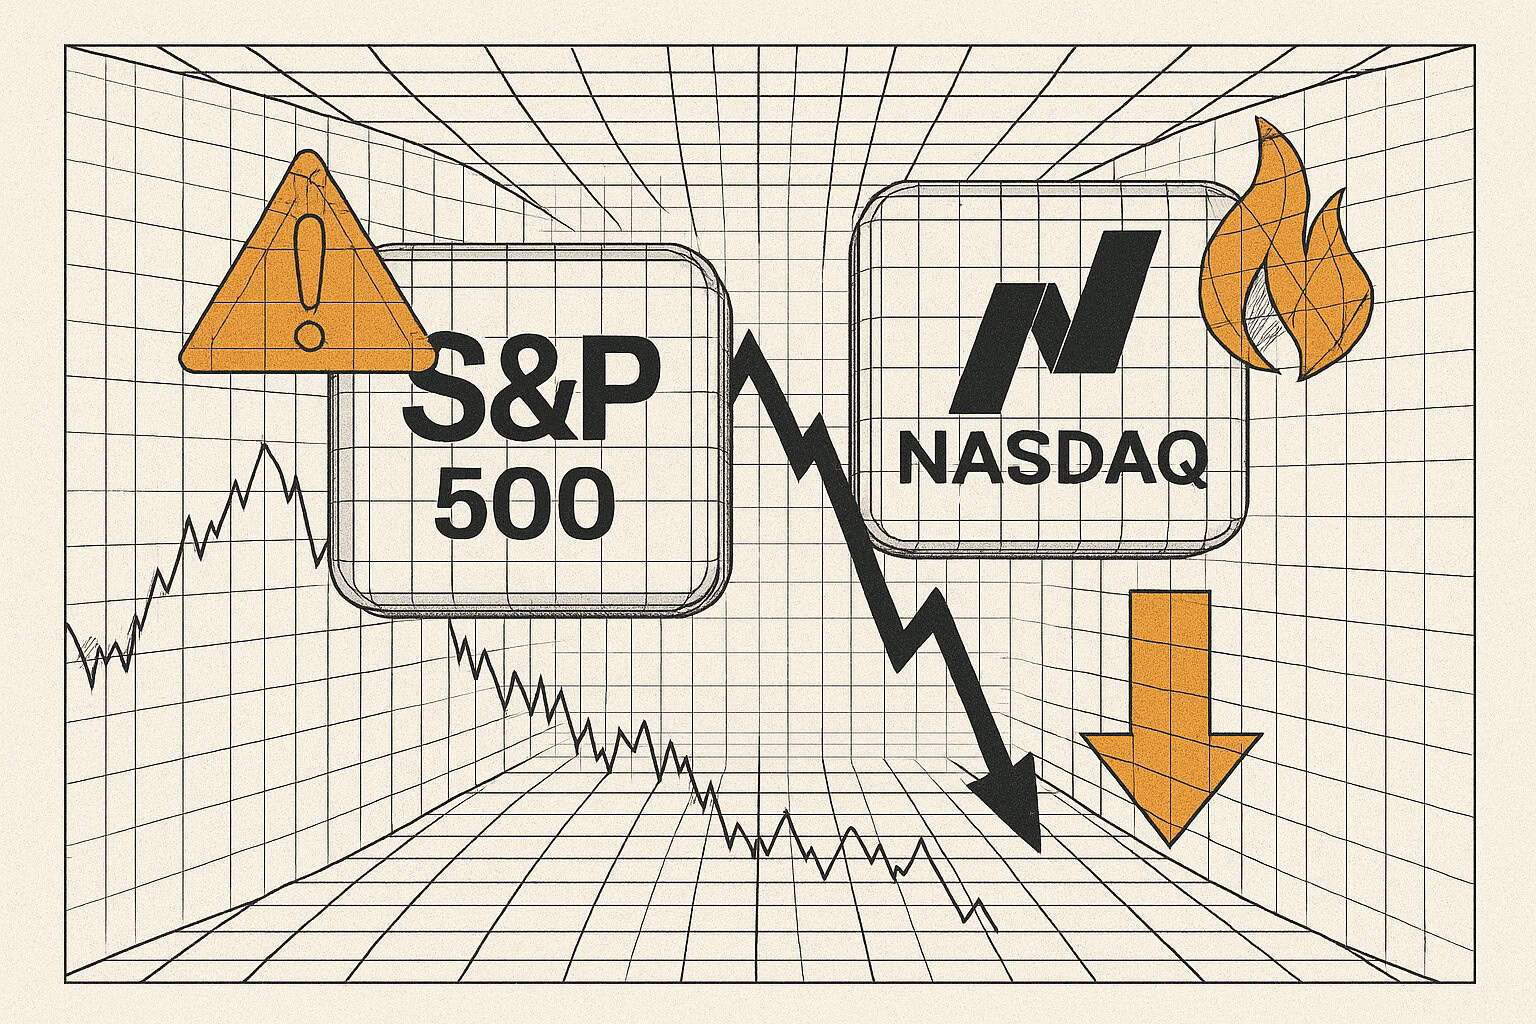
War Escalates, S&P 500 and Nasdaq at Risk of Decline
This weekly open is lining up to be a volatile one — especially for American markets.
On the technical side, the S&P 500 and Nasdaq 100 weekly charts are flashing warning signals. The S&P 500 has printed a tweezer top, a potential bearish reversal pattern, while the Nasdaq 100 appears to have formed a failed breakout above the Value Area High (VAH) — hinting at fading momentum.
Fundamentally, tensions in the Middle East have escalated. Over the weekend, the U.S. conducted a surprise military operation linked to the ongoing Iran-Israel conflict — despite President Trump having previously issued a two-week ultimatum for Iran to de-escalate. The early strike caught markets off guard, and 24/7 assets like Bitcoin reflected the risk-off mood, tumbling more than 4.5%.
If equities follow suit, conservative downside targets sit around the 4–5% range, but an extended correction of 6–7% can’t be ruled out in the short term. There’s also a case to be made about the yearly top being in — resulting in a 20% correction.
Either way, it would not be surprising if markets take on a risk-off approach this week.
S&P 500 Downside Targets
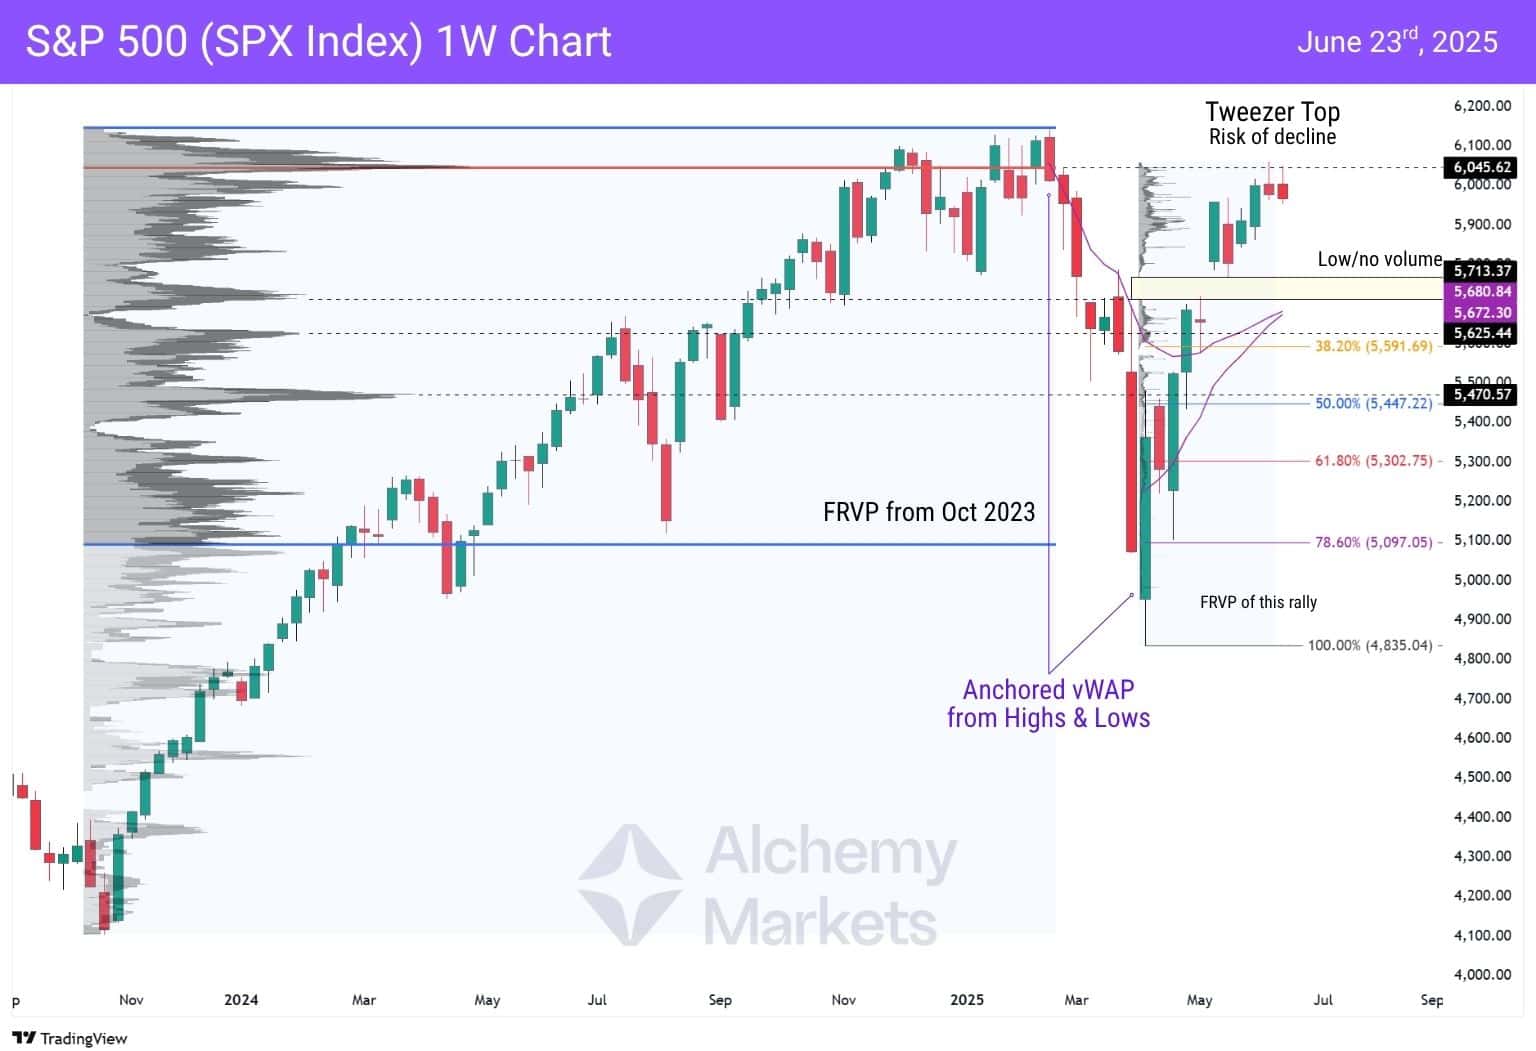
T1 — Market Gap at $5,713 and $5,767
- Aligns with the latest FRVP’s liquidity void — signalling the gap’s magnetic effect could still be in play
- Aligns with the Oct 2023 FRVP’s high volume node — signaling historical interest at these prices
T2 — Anchored vWAP Cluster at $5,672.30 and $5,680.84
- vWAP anchored at All-Time Highs, comes in at $5,680.84
- vWAP anchored at m March Lows, comes in at $5,672.30
- Aligns with high volume node at $5,625.44, which is near the 38.20% Fib at $5,591.69
T3 — Larger Correction down to 50% Fibonacci Retracement at $5,447.22
- Aligns with Oct 2023 FRVP high volume node at ~$5,470
NASDAQ Downside Targets
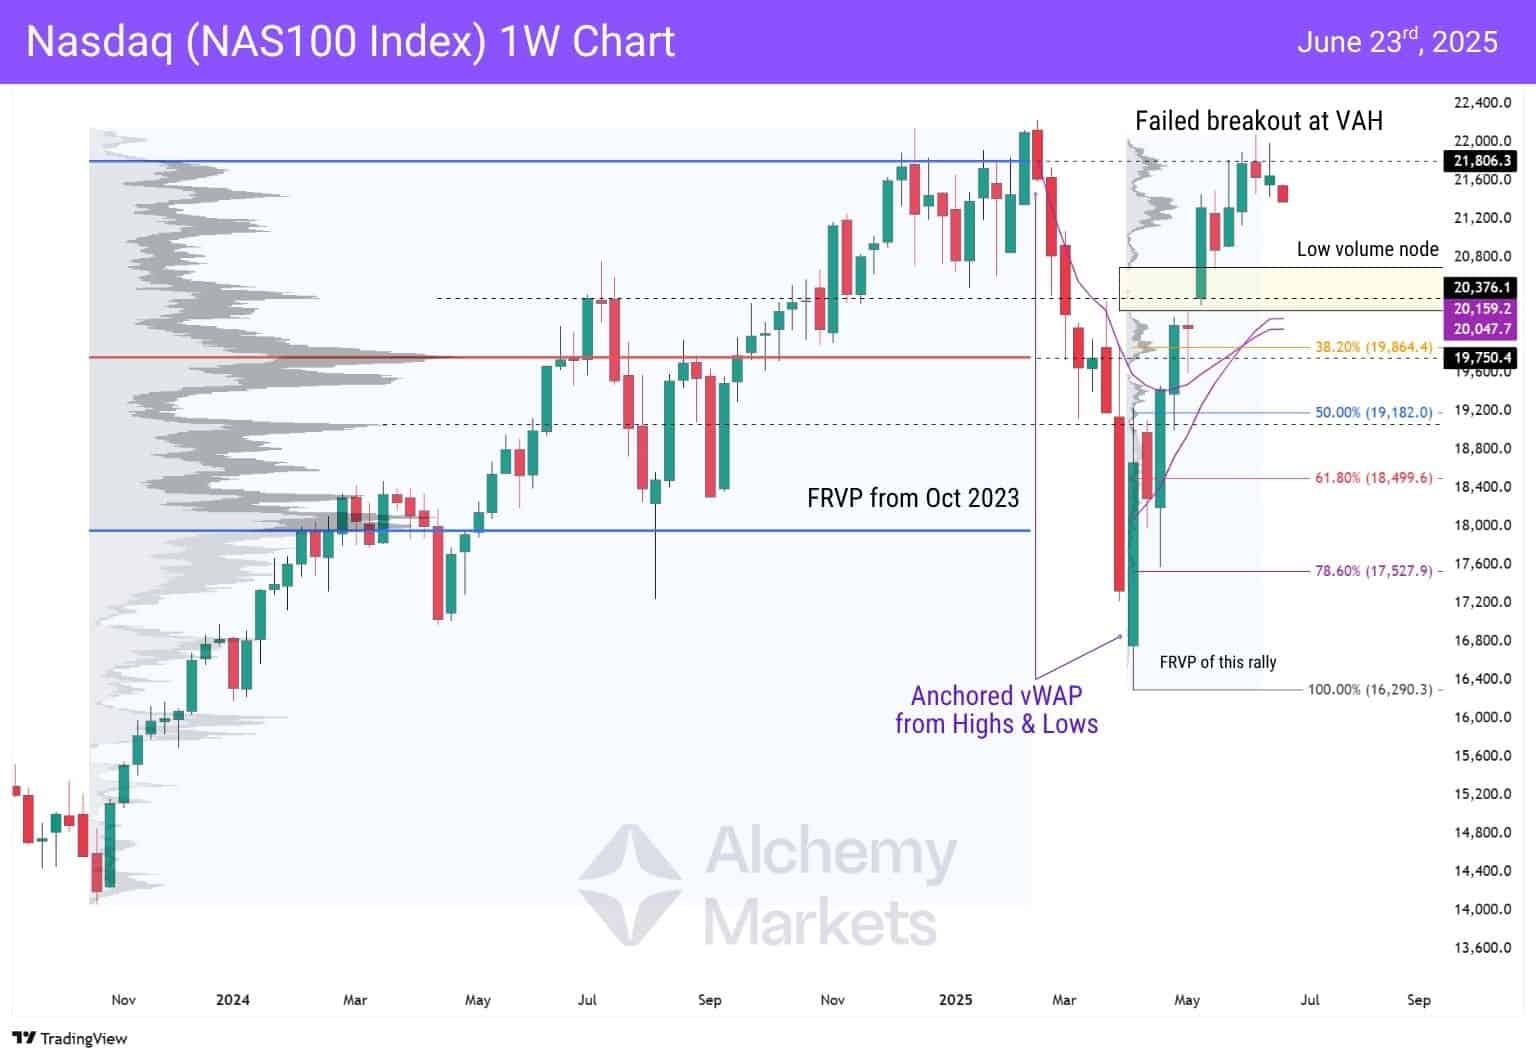
T1 — Low volume node/ Thin profile at $20,248 to $20,695 range
- Aligns with the latest FRVP’s liquidity void
- Aligns with the Oct 2023 FRVP’s high volume node, at around $20,376
T2 — Anchored vWAP Cluster at $20,047.7 and $20,159.2
- vWAP anchored at All-Time Highs, comes in at $20,047.7
- vWAP anchored at m March Lows, comes in at $20,159.2
- Aligns near high volume node at $19,750, which is near the 38.20% Fib at $19,864.4
T3 — Larger Correction down to 50% Fibonacci Retracement at $19,182.0
- Aligns with Oct 2023 FRVP high volume node at ~$19,060
Final Thoughts: Is the Yearly Top In?
If tensions escalate or drag out, a deeper correction toward the March 2025 lows would align with a larger ABC corrective structure — a common outcome in geopolitical-led pullbacks. While bulls still hold structural control, the current confluence of technical weakness and geopolitical uncertainty adds fuel to the bear case.
You may also be interested in:


