


Written by:


- Chart of the Day
- March 27, 2026
- 4 min read
SMH Is Cracking, but the Real Test Sits Lower
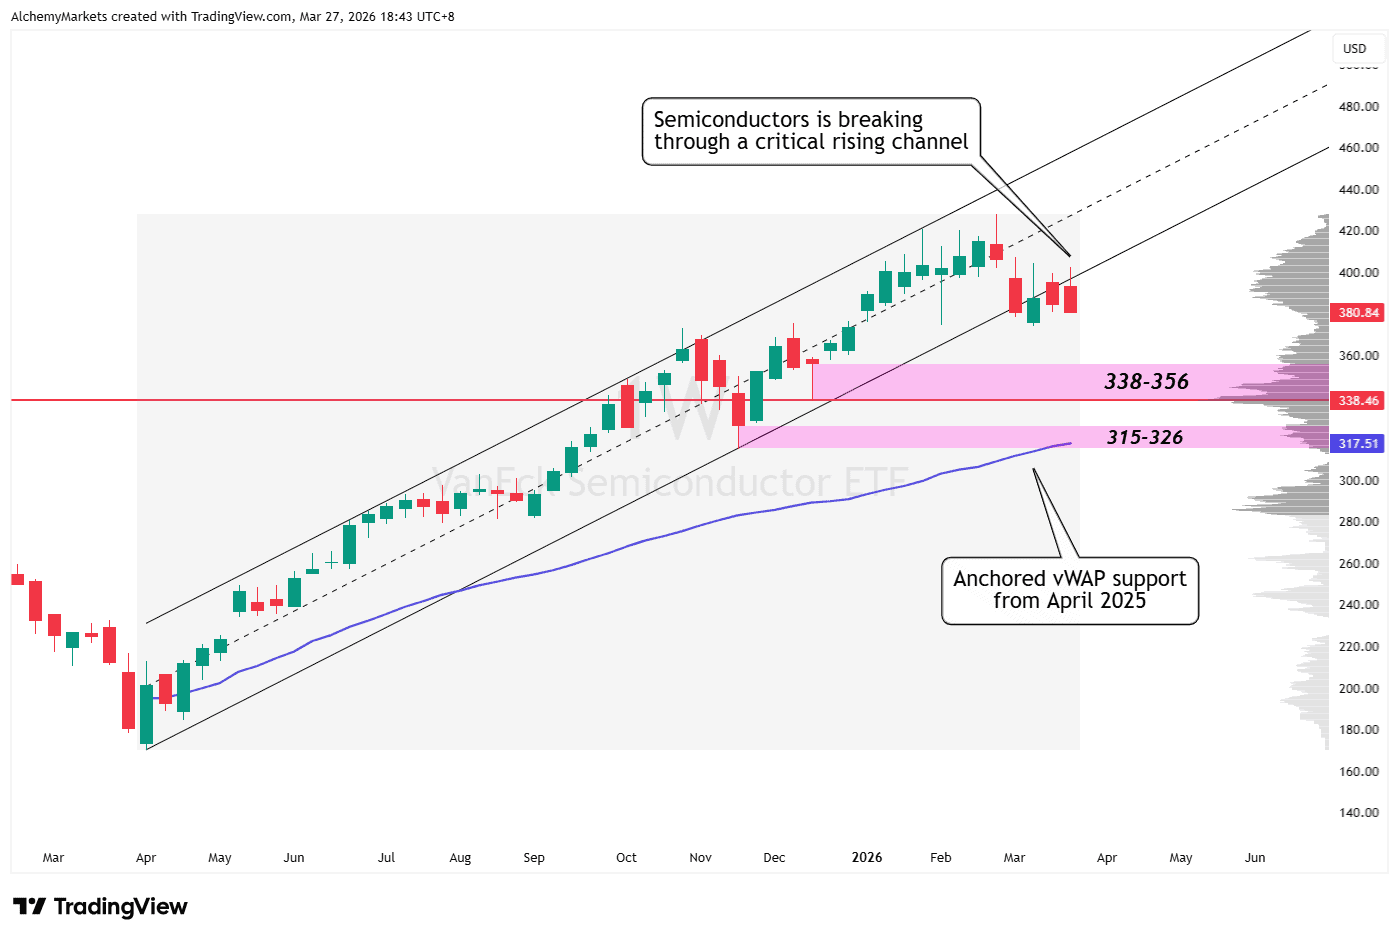
On the weekly linear chart, the VanEck Semiconductor ETF has started to lose the clean structure that defined its advance from the April 2025 low.
SMH had been riding a well-behaved rising parallel channel, but price slipped below that lower boundary three weeks ago and has still not reclaimed it. That matters because failed re-entry attempts often tell the market that a trend is no longer just pausing. It is losing control.
$400 Has Become the Reclaim Level
For now, the key line in the sand is simple: $400. Recent market commentary has been circling the same area. Barron’s said SMH has been struggling at $400 and flagged that a break below roughly $375 could expose a move toward the low-$300s. That does not guarantee a collapse, but it does show the broader market is reading semis the same way: momentum has weakened, and the old leadership trade is no longer getting the benefit of the doubt.
That makes the current setup more than just a messy pullback. If SMH cannot reclaim $400, the chart stays in a damaged state. If it does reclaim that level, the recent weakness can still be framed as a stress event rather than a lasting trend failure.
Volume Profile Says the Real Test Sits Lower
The volume profile on the chart supports that view. The first meaningful area of prior acceptance sits around 338–356, which lines up with a visible high-volume shelf. That is the first zone where buyers would be expected to show up if the current weakness extends. Below that, the 315–326 area looks like the deeper support cluster, helped by the anchored VWAP rising into the same region.
That is the important distinction. SMH may already be cracking on trend structure, but the real technical test is lower. A chart can lose its clean channel and still remain in a broader bull market if it finds support at a major acceptance zone. If those shelves fail, the tone changes fast.
Why SMH Matters More Than One ETF
SMH is not a niche vehicle. It is a highly concentrated way to express the semiconductor and AI infrastructure trade.
VanEck’s latest fact sheet shows the ETF’s top 10 holdings account for 74.76% of assets, led by Nvidia at 17.73%, TSMC at 11.44%, Broadcom at 6.90%, Micron at 6.47%, and ASML at 5.96%. When SMH weakens, it is usually the market leaning against the core of the chip complex, not just a few fringe names.
That is why traders are paying attention. Reuters reported this week that the Nasdaq has fallen into correction territory, down nearly 11% from its October peak, with heavily weighted AI-linked names such as Nvidia, Microsoft, Alphabet and Meta contributing to the drag.
In other words, semiconductors are not just part of the story. They are one of the mechanisms through which pressure spreads into the broader market.
Why Investors May Be Less Interested in SMH Right Now
The first reason is valuation and CapEx risk. Reuters reported that Alphabet, Amazon, Meta and Microsoft are expected to spend roughly $650 billion on AI-related infrastructure in 2026. That scale is impressive, but it also raises a harder question: when does the return show up? If investors stop assuming every extra dollar of AI capex will become future profit, chip names can de-rate even if demand remains healthy.
The second is hardware-specific macro risk. Reuters reported this week that the helium shortage linked to the Middle East conflict is already affecting tech supply chains. Helium is critical for several semiconductor manufacturing processes, and Qatar accounts for nearly one-third of global production. For software companies, war and oil are mostly valuation problems. For semiconductors, they can also become production problems.
The third is rotation within tech itself. Earlier this year, Reuters reported that leadership in U.S. equities had started broadening beyond tech, with the equal-weight S&P 500 outperforming the standard cap-weighted version since late October. That is usually what happens when investors become less comfortable relying on the same handful of megacap winners.
Bottom Line
SMH is not just losing a channel. It is testing whether one of the market’s most important leadership groups can still carry the same weight it did over the last year.
The weekly damage is real. Price has spent three straight weeks outside the rising channel and has not reclaimed it. The reclaim level is clear at $400. But the more important read comes from the volume profile. The first serious test sits at 338–356, with a deeper support zone at 315–326.
If those areas hold, the move can still be treated as a correction inside a bigger AI-led bull trend. If they fail, the message becomes harder to ignore: the very group that helped prop up the Nasdaq and S&P 500 is no longer acting like leadership.


