


Written by:


- Chart of the Day
- June 12, 2025
- 3 min read
Silver Breaks Out: Confirming the End of Wave 2 and the Start of a Bullish Wave 3 Sequence
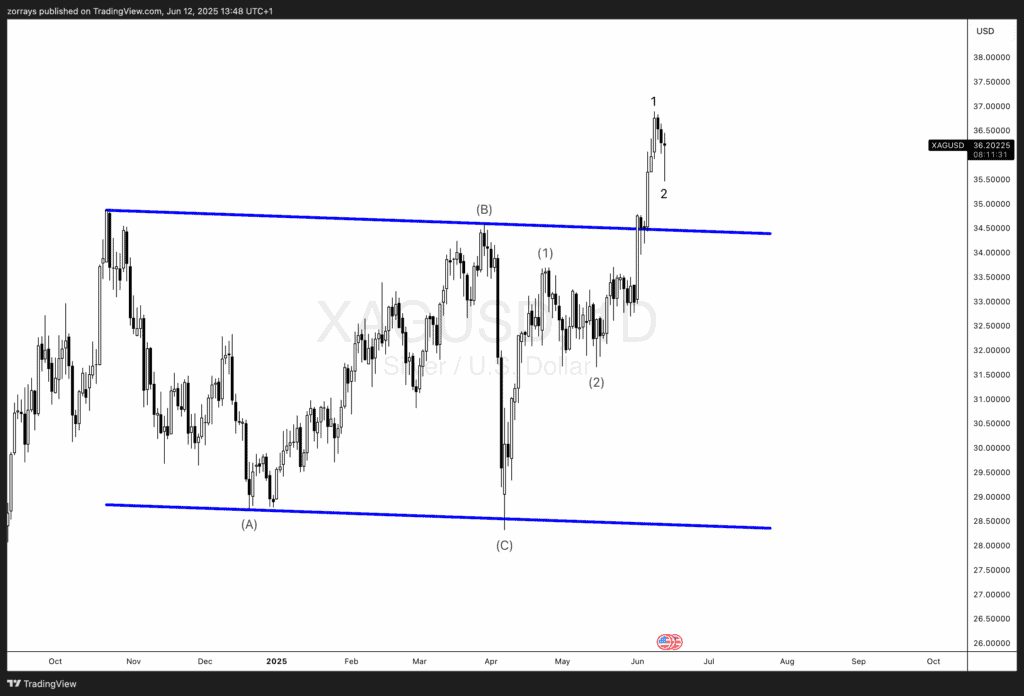
Silver (XAG/USD) has completed a textbook A-B-C correction, forming a large flat or triangle base structure that likely marks the end of a multi-month Wave 2. The powerful breakout through resistance and impulsive follow-through confirm the early stages of Wave 3. After a shallow Wave 2 pullback on lower timeframes, the bullish sequence is expected to continue with extended upward potential.
Wave Context: From Correction to Impulse
Looking at the broader daily structure:
- Wave (A): The initial leg down, sharp and impulsive.
- Wave (B): A complex, time-consuming rally with multiple internal subdivisions.
- Wave (C): A final washout leg that terminated right at the triangle base support.
This forms a clear A-B-C correction, likely a running flat or contracting triangle, ending around the $28.00–$29.00 region. This structure is consistent with a larger degree Wave 2, given the depth and complexity relative to the preceding advance.
Breakout Above Resistance: The Confirming Impulse
The price action following the Wave (C) low is the most compelling evidence:
- Clean 5-wave subdivision visible from the lows into the recent peak near $36.50.
- No overlapping structure—classic impulsive behavior.
- Volume and momentum confirm buying strength.
Most importantly, price has broken above the triangle’s upper boundary, a line that had capped rallies since late 2023. This breakout confirms Wave 1 of Wave 3 has completed and Wave 2 is unfolding.
Wave 2 Pullback Already in Progress
The current move down is likely a minor Wave 2 correction:
- Retracing just under 38.2% of Wave 1 (common for shallow Wave 2s in commodities).
- Price remains above the previous breakout zone around $34.50.
- No violation of impulsive structure yet.
This presents a buy-the-dip opportunity, particularly as momentum indicators begin to reset without breaking structure.
Bullish Implications of Wave 3 Launch
Assuming the count is correct and we are in Wave 3 of III, the implications are significant:
- Wave 3s are the strongest, fastest, and longest-lasting of all motive waves.
- A conservative Fibonacci extension (1.618 of Wave 1) targets $41.50–$43.00.
- If Silver accelerates and Wave 3 extends, we could see levels as high as $45–$47 before Wave 4 even begins.
Alternate View: Ending Diagonal or Truncated Fifth?
While the primary count remains a classic impulse, two alternate views should be considered:
- Ending diagonal: If Wave (C) was a diagonal, we may still be in an early Wave 1 structure rather than starting Wave 3.
- Truncated C: If Wave (C) didn’t make a new low, it’s possible Wave 2 was shallow and ended earlier than expected.
However, price behavior post-breakout, especially with sustained trade above the triangle resistance, supports the primary impulsive count.
Trade Strategy and Risk Management
For long setups:
- Consider scaling in on dips between $35.00–$34.40.
- Initial stop below $33.80 (breakout retest).
- First target at $39.50, extended target $43.00.
For invalidation:
- Break below Wave (2) lows near $31.50 would require reassessment of the bullish count.
Conclusion: Silver is Entering a High-Probability Bullish Phase
All signs point to Silver having completed a large-degree Wave 2 and now in the early stages of a bullish Wave 3. The breakout through long-standing resistance, the impulsive price action, and the clean wave structure provide a high-confidence roadmap. As long as recent breakout levels hold, the bias remains strongly bullish, with substantial upside ahead.


