- Chart of the Day
- July 25, 2024
- 6 min read
Revisiting an Old Friend: The Beauty of Elliott Wave Analysis in AUD/USD
In the world of forex trading, flexibility is key. One of the most rewarding aspects of trading is the ability to adjust your perspective in the face of changing market conditions. The AUD/USD pair has recently provided a textbook example of this dynamic adaptability, particularly through the lens of Elliott Wave Theory. Initially, we held a bullish outlook for AUD/USD, but as the market evolved, we quickly recognized the need to shift our stance. This is where the elegance of Elliott Wave analysis truly shines, allowing traders to pivot effortlessly from one scenario to another based on emerging patterns and market fundamentals.

The Elliott Wave Framework
The Elliott Wave Theory, developed by Ralph Nelson Elliott, is a powerful tool for understanding market psychology and forecasting future price movements. It posits that market prices move in predictable cycles, driven by collective investor psychology. These cycles are typically composed of five waves in the direction of the main trend, followed by three corrective waves. The theory is particularly useful in identifying potential trend reversals and continuation patterns.
A Bullish Beginning
At the outset, our analysis of the AUD/USD pair indicated a bullish trend. This was supported by a series of impulsive waves that suggested strong upward momentum. However, the beauty of Elliott Wave Theory lies in its flexibility. As the market started to show signs of a potential downturn, we quickly reevaluated our position.
A Quick Shift to Bearish Bias
As soon as the AUD/USD began to decline, we were prompted to reconsider our bullish stance. The shift in market sentiment was clear, and the fundamentals provided a compelling case for a bearish outlook. Specifically, the interest rate differentials and the pair’s role as a carry trade instrument added to the bearish narrative. It became evident that the initial impulsive wave structure might not continue as expected.
Identifying the Triangle Pattern

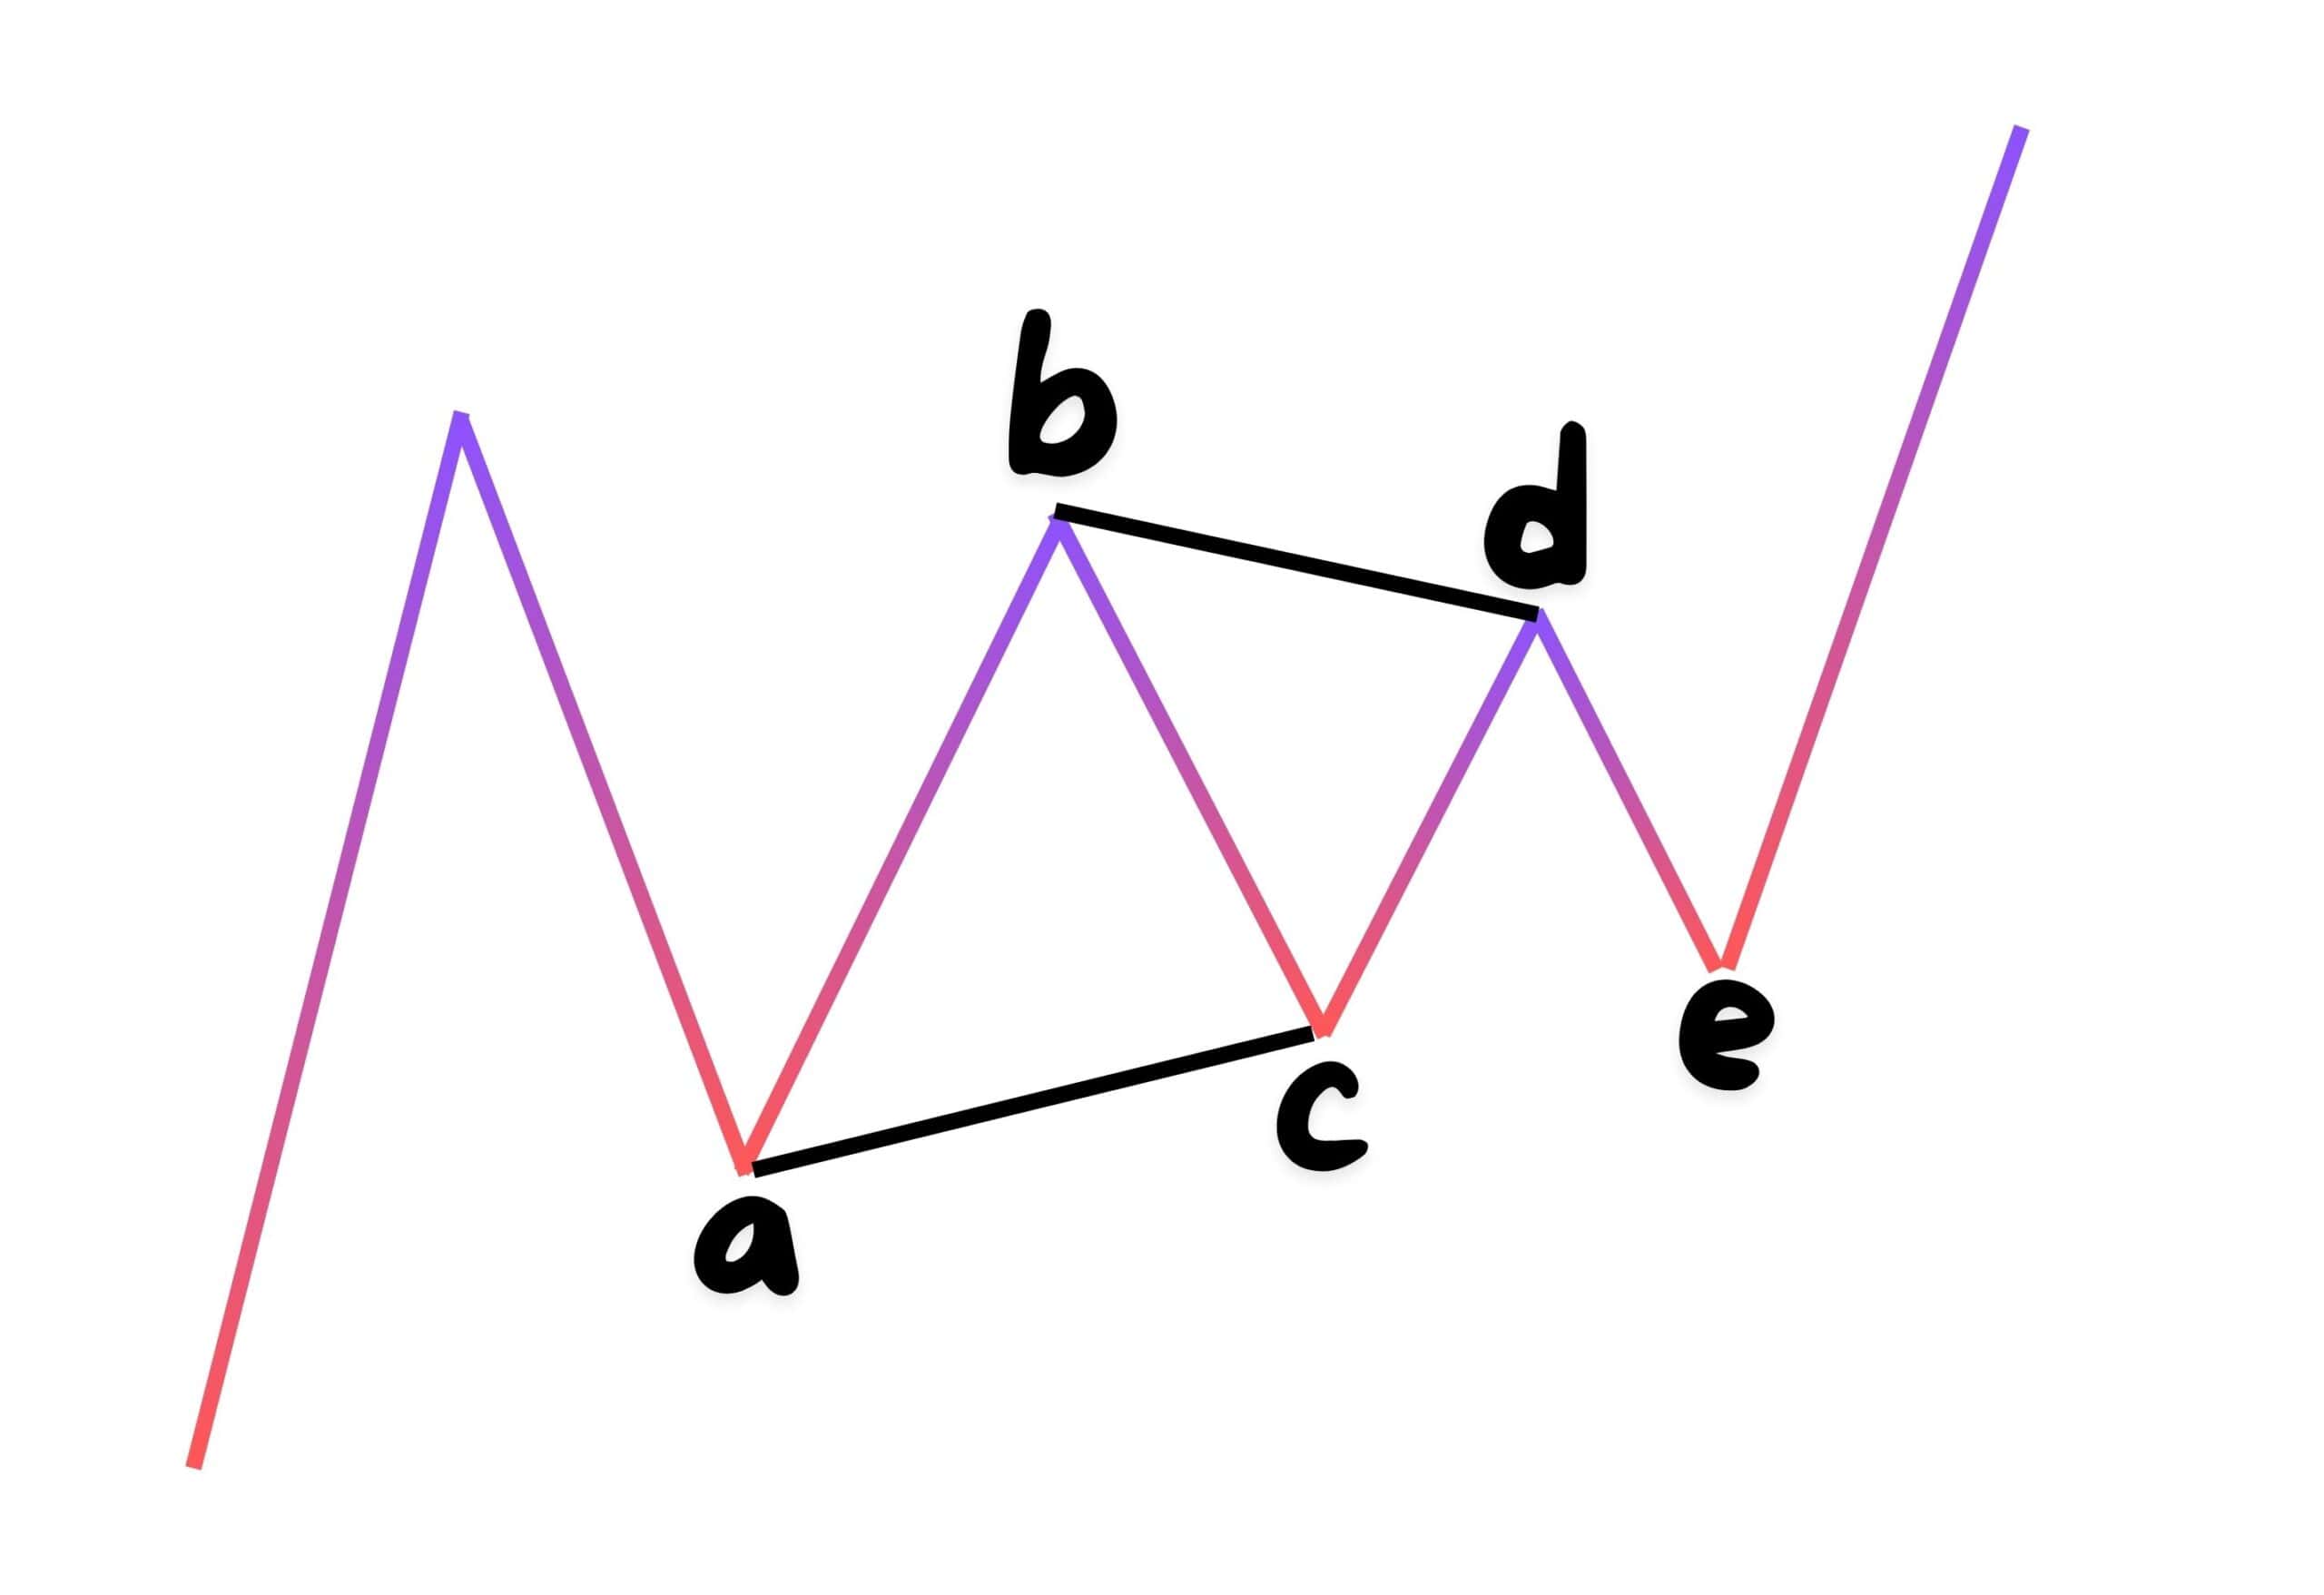
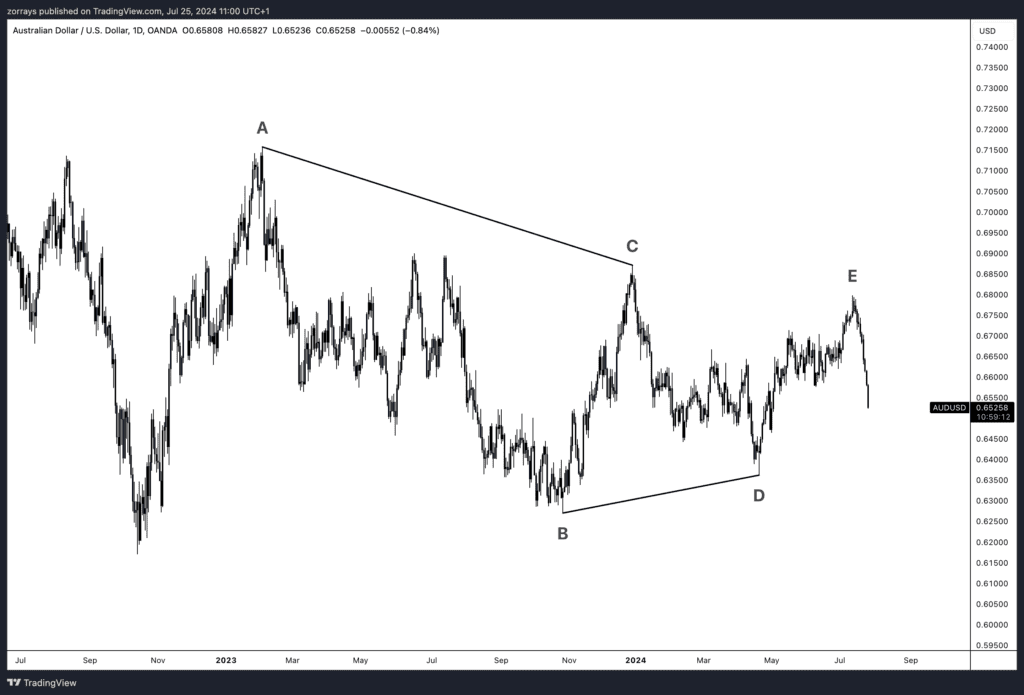
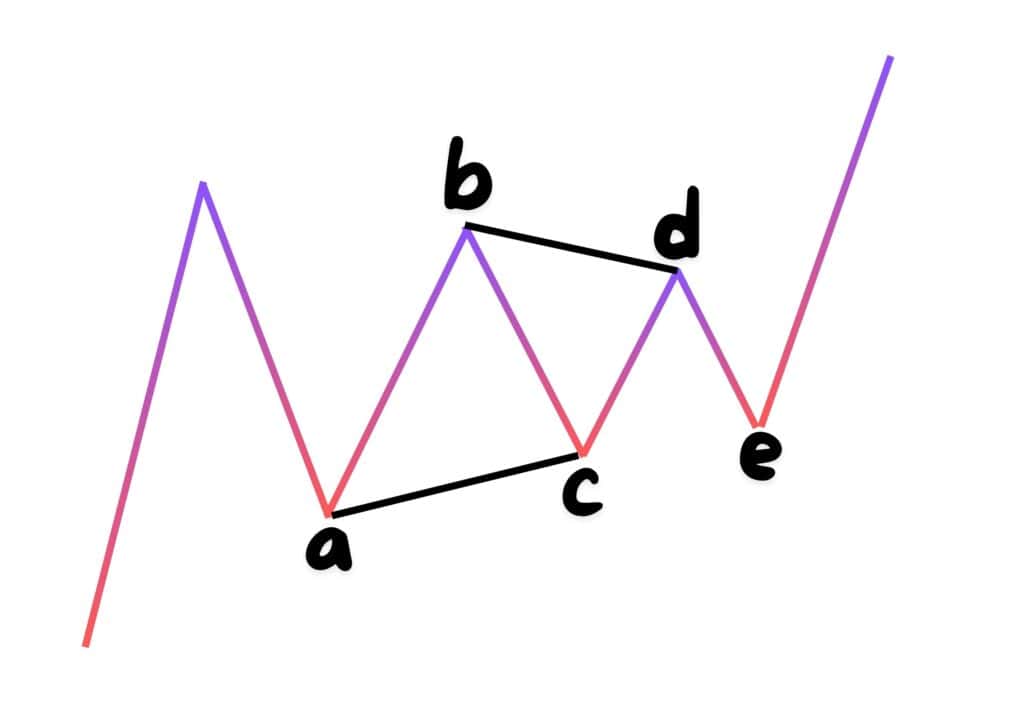
In technical analysis, a triangle pattern is a consolidation pattern that can indicate either a continuation or a reversal in the trend. Upon reevaluating the AUD/USD pair, we identified a developing triangle pattern, characterized by the classic ABCDE wave formation. This pattern suggested that the pair might be setting up for a breakout, potentially leading to significant price movements.
The key levels to watch were the points labeled A, B, C, D, and E on the chart. Each of these points represented critical highs and lows that formed the boundaries of the triangle. The pattern remained untriggered, indicating that the market was still in a state of indecision, but the formation suggested a bearish bias might soon be confirmed.
Fundamental Insights: Carry Trade and Interest Rates
Fundamentally, the AUD/USD pair is often influenced by the differential between Australian and U.S. interest rates. The Australian dollar is considered a high-yielding currency, often used in carry trades, where investors borrow in a low-interest currency and invest in a higher-yielding one. However, recent shifts in interest rate policies and economic outlooks have made the U.S. dollar more attractive, thereby exerting downward pressure on the AUD/USD pair.
Trading the Triangle: Strategies and Considerations
For traders looking to capitalize on this pattern, the untriggered triangle offers a range of opportunities. Short-term traders may consider dropping down to lower timeframes, such as the 1-hour or 15-minute charts, to refine their entry and exit points. This allows for more precise trade management and the ability to react quickly to market movements.
For those with a longer-term perspective, waiting for a confirmed breakout from the triangle’s boundaries could provide a clearer signal. In either case, risk management is crucial. Setting stop-loss orders just outside the triangle can help mitigate potential losses if the market moves against your position.
Lessons Learned and Moving Forward
The recent developments in the AUD/USD pair underscore the importance of staying adaptable and using technical analysis tools like Elliott Wave Theory. By quickly shifting our bias from bullish to bearish, we were able to align our trading strategy with the market’s evolving conditions. The identification of the triangle pattern was particularly useful, providing a clear framework for anticipating future price movements.
FAQs
How does Elliott Wave Theory help in forex trading?
Elliott Wave Theory provides a framework for understanding market cycles and investor psychology, helping traders identify potential trend reversals and continuation patterns.
What is a triangle pattern in technical analysis?
A triangle pattern is a consolidation pattern that can indicate either a continuation or a reversal in the trend. It is characterised by converging trendlines that form a triangular shape.
Why did the AUD/USD pair shift from bullish to bearish?
The shift was influenced by a change in market sentiment and fundamentals, particularly interest rate differentials and the pair’s role as a carry trade instrument.
How can traders use the triangle pattern in their strategy?
Traders can use the triangle pattern to anticipate potential breakouts. Short-term traders may use lower timeframes for precision, while longer-term traders may wait for a confirmed breakout.
What role do interest rates play in the AUD/USD pair?
Interest rates influence the attractiveness of the AUD/USD pair as a carry trade. Higher rates in one currency relative to another can lead to increased demand for the higher-yielding currency.
What should traders consider when trading the AUD/USD pair?
Traders should consider both technical and fundamental factors, such as interest rates and economic data, while also using risk management strategies like stop-loss orders.
Conclusion
The recent developments in the AUD/USD pair offer a fascinating case study in the application of Elliott Wave Theory and technical analysis. By staying flexible and open to new patterns, traders can adapt to changing market conditions and find profitable opportunities. The identification of the triangle pattern was particularly valuable, providing a clear framework for anticipating future price movements. As always, thorough analysis and sound risk management are key to successful trading.
Disclaimer: For educational purposes only. Trading comes with substantial risk, leading to possible loss of your capital. Traders are advised to do their own due diligence before investing.


