


Written by:


- Chart of the Day
- May 6, 2025
- 2 min read
Kiwi Fights Back: NZD/JPY Breaks Multimonth Trendline to Upside
After a multi-month downtrend, NZD/JPY has broken a significant trendline resistance dating back to November 2024- flashing a sign of resilience, or perhaps a glint of a trend reversal…?
Only time will tell – but the message is clear: Though Kiwis can’t fly, this pair could perhaps take off.
Broader Implications if NZD/JPY Recovers
The Kiwi Dollar is well known to be a risk-on currency.
This potential breakout is perhaps a clue that investors have regained some hope in the markets; especially with positive NFP Jobs Reports, and the successful minerals deal between U.S. and Ukraine.
However, we must stay vigilant as tomorrow is the FOMC, where unexpected volatility may impact the markets. Hawkishness is expected; but if it is unexpectedly hawkish, NZD/JPY may struggle in its recovery.
Technical Breakdown of NZD/JPY 1D Chart
So far, NZD/JPY 1D is printing what appears to be a classic bear trap. There is a Class B Bullish Divergence, where the RSI is forming equal lows but the price is forming a significant lower low.
Alongside the trendline break, if NZD/JPY can hold above 85, then a rally towards the 90 price range would seem more likely.
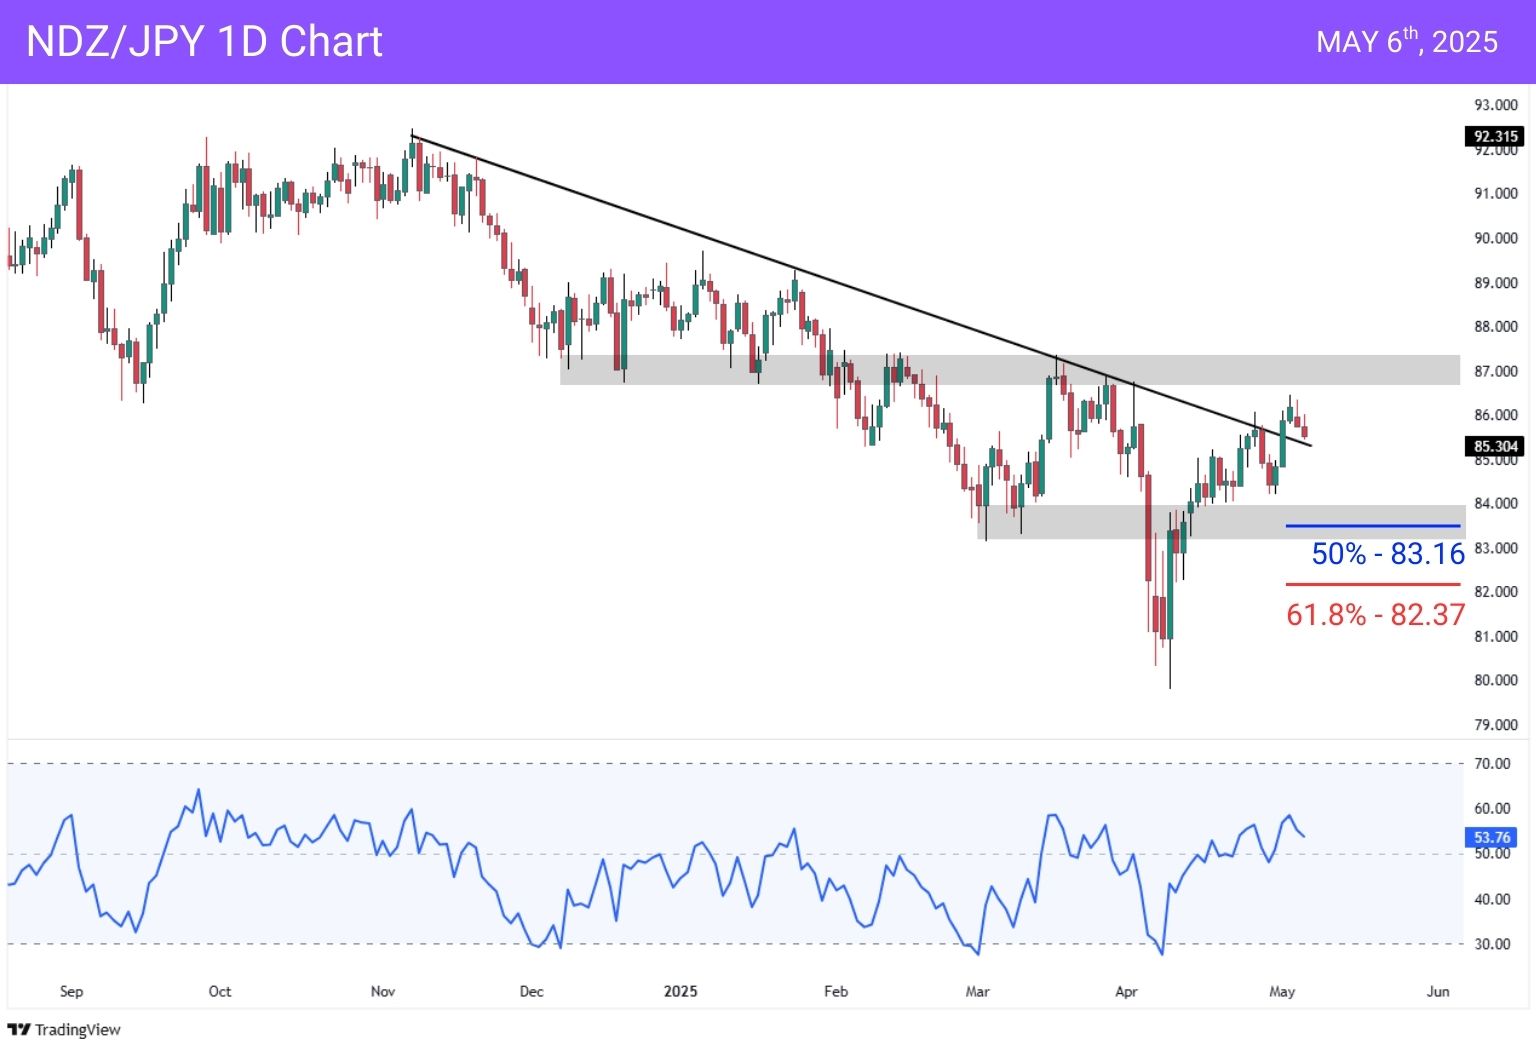
In the event NZD/JPY cannot hold 85, a retracement towards the support between 83 and 84 is possible. This region aligns nicely with a 50% Fibonacci retracement at 83.16, which could provide the fuel for a bounce. But if not; we can look towards the 61.8% retracement at 82.37.
You may also be interested in:


