


Written by:


- Chart of the Day
- June 10, 2024
- 3 min read
Nvidia Stock Split Bearish for Price Based on History
As Nvidia initiates its stock split on June 10th, 2024 (Monday), investors are curious as to how the price of the stock will be affected in the short and mid term.
The split conditions are 10-for-1, leading to holders holding 10 times more the share they already own.
What is a Stock Split?
A stock split is when a company increases the quantity of available stock shares. Going by the simple logic of supply and demand, a stock split will result in a price decrease as it increases the stock’s supply. This decrease in price will not directly affect the price charts, but rather decrease the price flat out to its split amount.
In the case of Nvidia, a single share will be split into 10 shares, which would lead its price to decrease from $1000+ to the projected average price of $120.
What happened before when Nvidia did a Stock Split?
Based on previous stock splits of Nvidia, the stock’s price tends to fall after a while of consolidating towards the upside. This example above shows the stock split in 2007, where the NVDA stock dropped by over 70% after 2 months of continuously grinding up on the EMA 20.
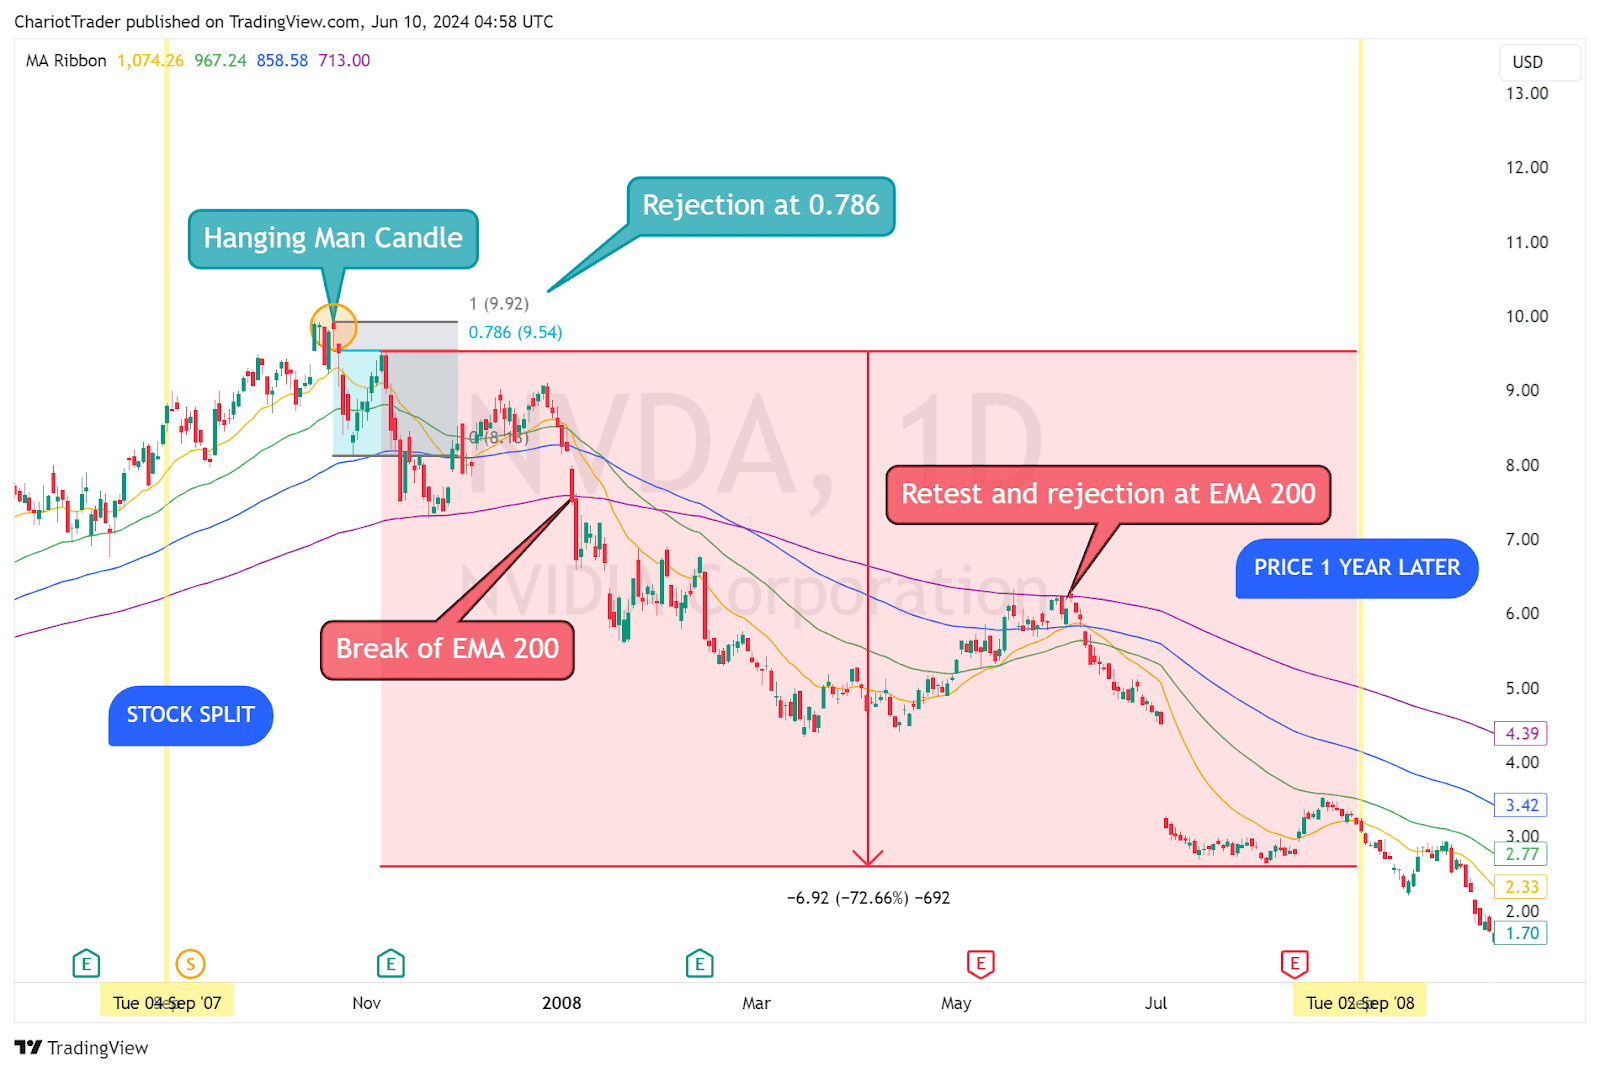
Signs of reversal came in the form of a break of the 1D EMA 20, followed by a rejection from the 0.786 Fibonacci retracement. Then, price forms a lower low at the 1D EMA 200, which then is eventually broken, leading to a cascade of bearish price action lasting roughly for a year.
| Key Takeaways: Historically, Nvidia Stock Split has always resulted in a price fall of 40% or more. Look for signs of a reversal with the market structure and 1D EMA 20 and EMA 200. |
So what does this mean for Nvidia’s price in the short term?
Technical Analysis on NVDA (2024 June 10th)
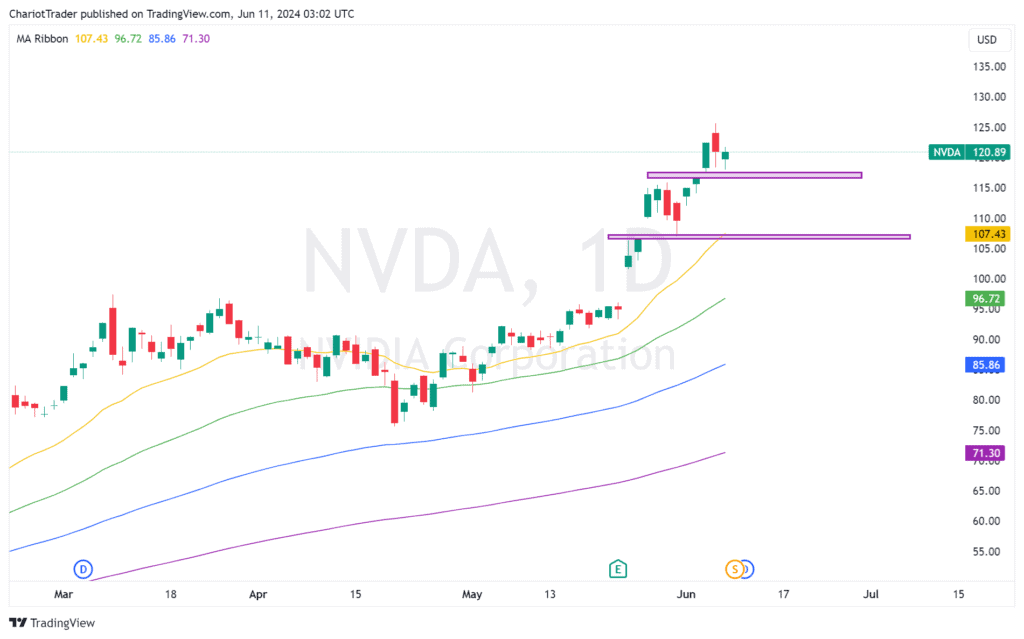
There are two price gaps in NVDA at approximately $117.70 and $107.40.
Since price gaps are filled more often than not, the stock split could act as the bearish catalyst to push the price lower to test these gaps. Given how the asset is still in an uptrend, we can look towards these gaps as an area for a temporary bounce.
Again, the stock split has historically exerted bearish pressure on the NVDA price, so it is a good idea to look for signs of a bearish reversal. This can come in the form of a:
- Potential Double Top
- Breaking of 1D EMA 20 (Early Signs of Reversal)
- Breaking of 1D EMA 200 (Major Reversal Signal)
- Creating a Lower Low, then a Lower High at a Fibonacci Level (0.618 or 0.786)
We have to be aware that our gap at $117.70 can act as a neckline to form a double top bearish reversal pattern. Alternatively, we could dip lower, only to come back up to reject off the Fibonacci levels of 0.618 or 0.768, much like what happened in 2007.
Edit: This post has been updated to reflect the NVDA stock prices after the split.


