


Written by:

- Chart of the Day
- May 28, 2025
- 4 min read
Nvidia Earnings Report Sets Stage For Next Market Move
The Nasdaq 100 is currently the driving force of bullish price moves across the S&P 500, Dow Jones, and Bitcoin — with Nvidia being at the helm of the driver’s seat. And today, Nvidia will be releasing their earnings report, expected to show a 66% year-on-year revenue jump; a print that could either fuel a fresh leg higher or mark the peak of an overextended rally.
So all eyes are on Nvidia today, and until the report is released, the price could stall.
Rising Parallel Channel Contains the NVDA Price
Nvidia’s daily chart has been clean. Since bottoming at $86.62 in April, the price has been respecting a rising parallel channel, making higher highs and higher lows.
From an Elliot Wave structure perspective, this recent leg up could be Wave 3 of a 5-wave impulse, and if that’s true, we’re now sitting at a potential pause inside a tight $129.16–$137.40 range.
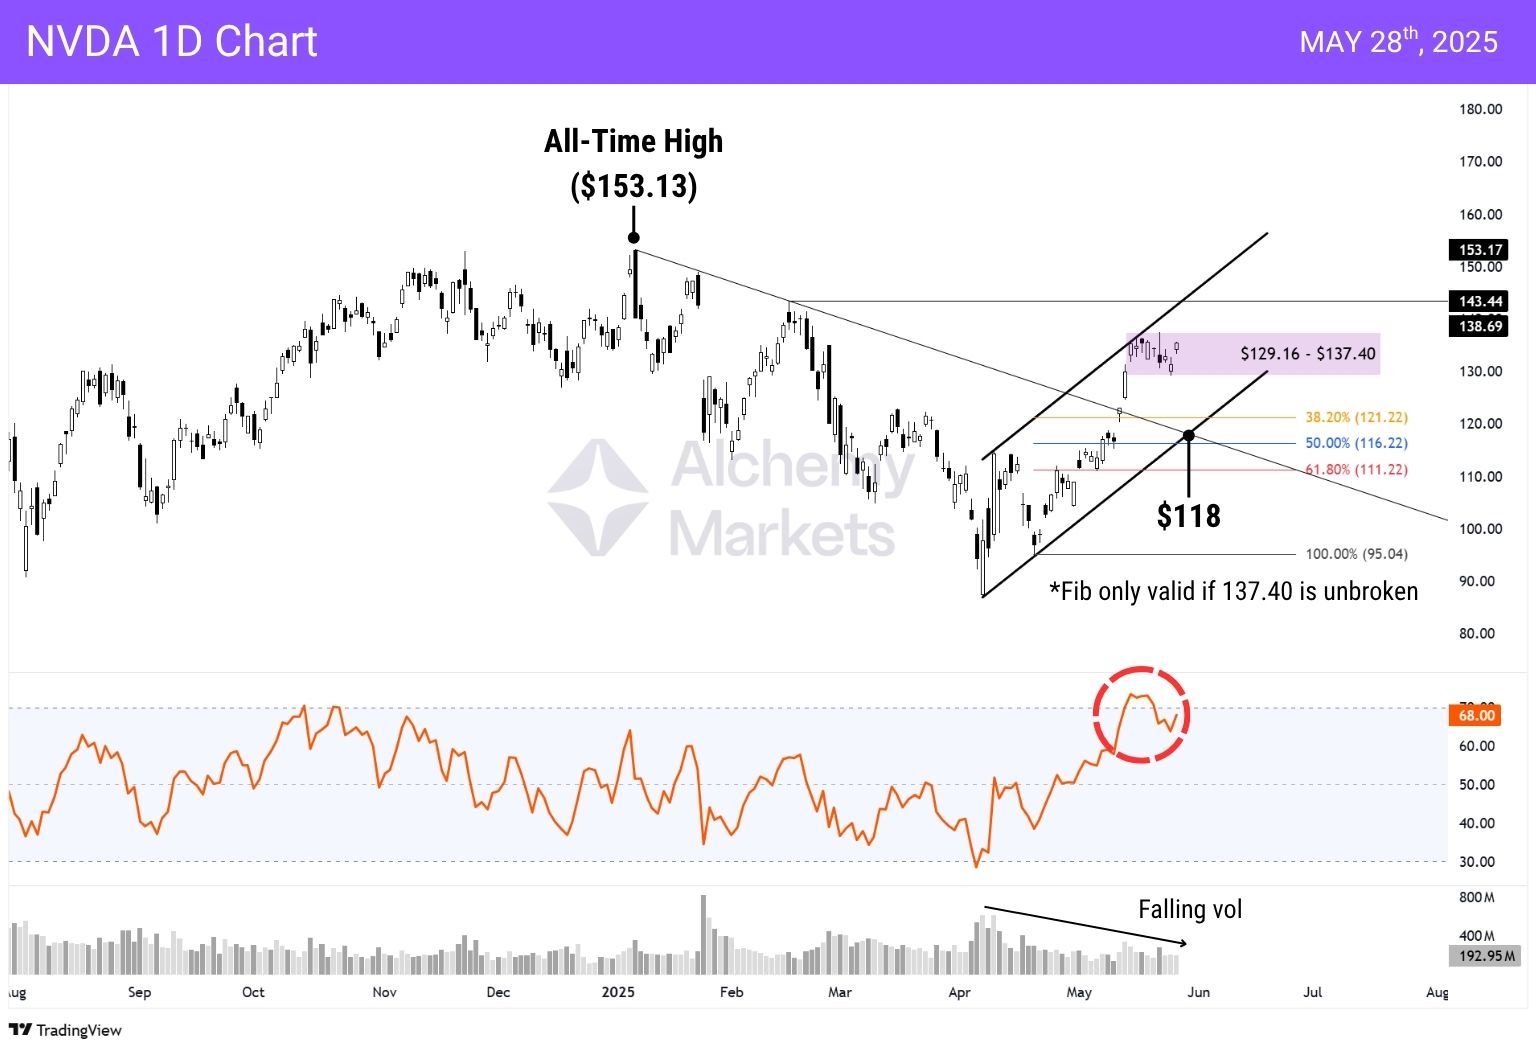
A break above this range would signal that Wave 3 isn’t over, and we could tap into $143.44, the previous high and upper trendline of the rising parallel channel. It would also invalidate the current Fib retracement and call for a redraw.
A break below this range would signal the likely formation of a wave 4 retracement, back down towards:
- 38.2% retracement ($121.22): Early support zone
- 50% retracement ($116.22): Classic mean-reversion target
- 61.8% retracement ($111.22): Deep correction territory — still valid, but more cautious outlook
Anything deeper than that, and we’re no longer talking Wave 4 — we’re likely seeing a broader structure breakdown.
Warning Signs Beneath the Surface
Let’s not get ahead of ourselves. Despite the bullish trend, a few caution lights are flashing.
🔸 RSI divergence has crept in — price is rising, but RSI isn’t confirming the same strength (see red circle on chart).
🔸 Volume has been falling, even during the recent Wave 3 impulse — a red flag for trend sustainability.
🔸 $137.40 is acting as a cap — and without volume or earnings momentum, a clean breakout may not come easily.
The Most Important Level: $118
If earnings disappoint or even slightly underwhelm, we could see a retracement. The most critical level to watch is $118.
Why? Because it sits at the cross-section of three key elements:
- The broken descending trendline (Now turned support)
- The lower boundary of the rising channel
- The 38.2% and 50% Fibonacci retracement zones
If price pulls back into $118 and holds, that’s your structural support and potential long setup. If it breaks, 61.8% ($111.22) becomes the key level, but would serve as a warning signal.
Earnings Will Decide
The earnings print today will act as the catalyst for a rise or fall on Nvidia.
A beat with strong guidance likely sends NVDA through $137.40, indicating bullish continuation. This would call for a redraw of the Fibonacci retracements, starting at $95.20 and ending at whatever high Nvidia punches in.
Alternatively, if the year-on-year revenue falls short of expectations (66% gain), or the guidance is underwhelming, expect a retest of the lower channel and a move toward $118.
Market Impact: If-Then Breakdown
| If NVDA beats earnings and raises guidance → Nasdaq 100 likely surges, with spillover gains in the S&P 500 and Dow → Bitcoin could push higher on renewed risk-on sentiment → Gold may pull back slightly as traders favour growth and tech over safety If NVDA beats but guidance is flat or cautious → Nasdaq may spike briefly, then fade → S&P 500 holds steady, Dow lags → Bitcoin likely chops sideways → Gold remains stable or sees mild safe-haven bids If NVDA misses or lowers forward guidance → Nasdaq leads a tech pullback → S&P 500 and Dow follow with moderate downside → Bitcoin dips as risk appetite cools → Gold bounces — flight to safety likely, especially if yields soften |
Bottom line: NVDA is the ignition switch. Whether markets accelerate or stall out depends on how strong this earnings engine fires.
You may also be interested in:


