- Chart of the Day
- May 5, 2025
- 3 min read
Pivotal Resistance: Nasdaq and S&P at the Daily 200 EMA
Both the Nasdaq and S&P 500 have pushed into major technical resistance, trading right up into their daily 200 EMAs.
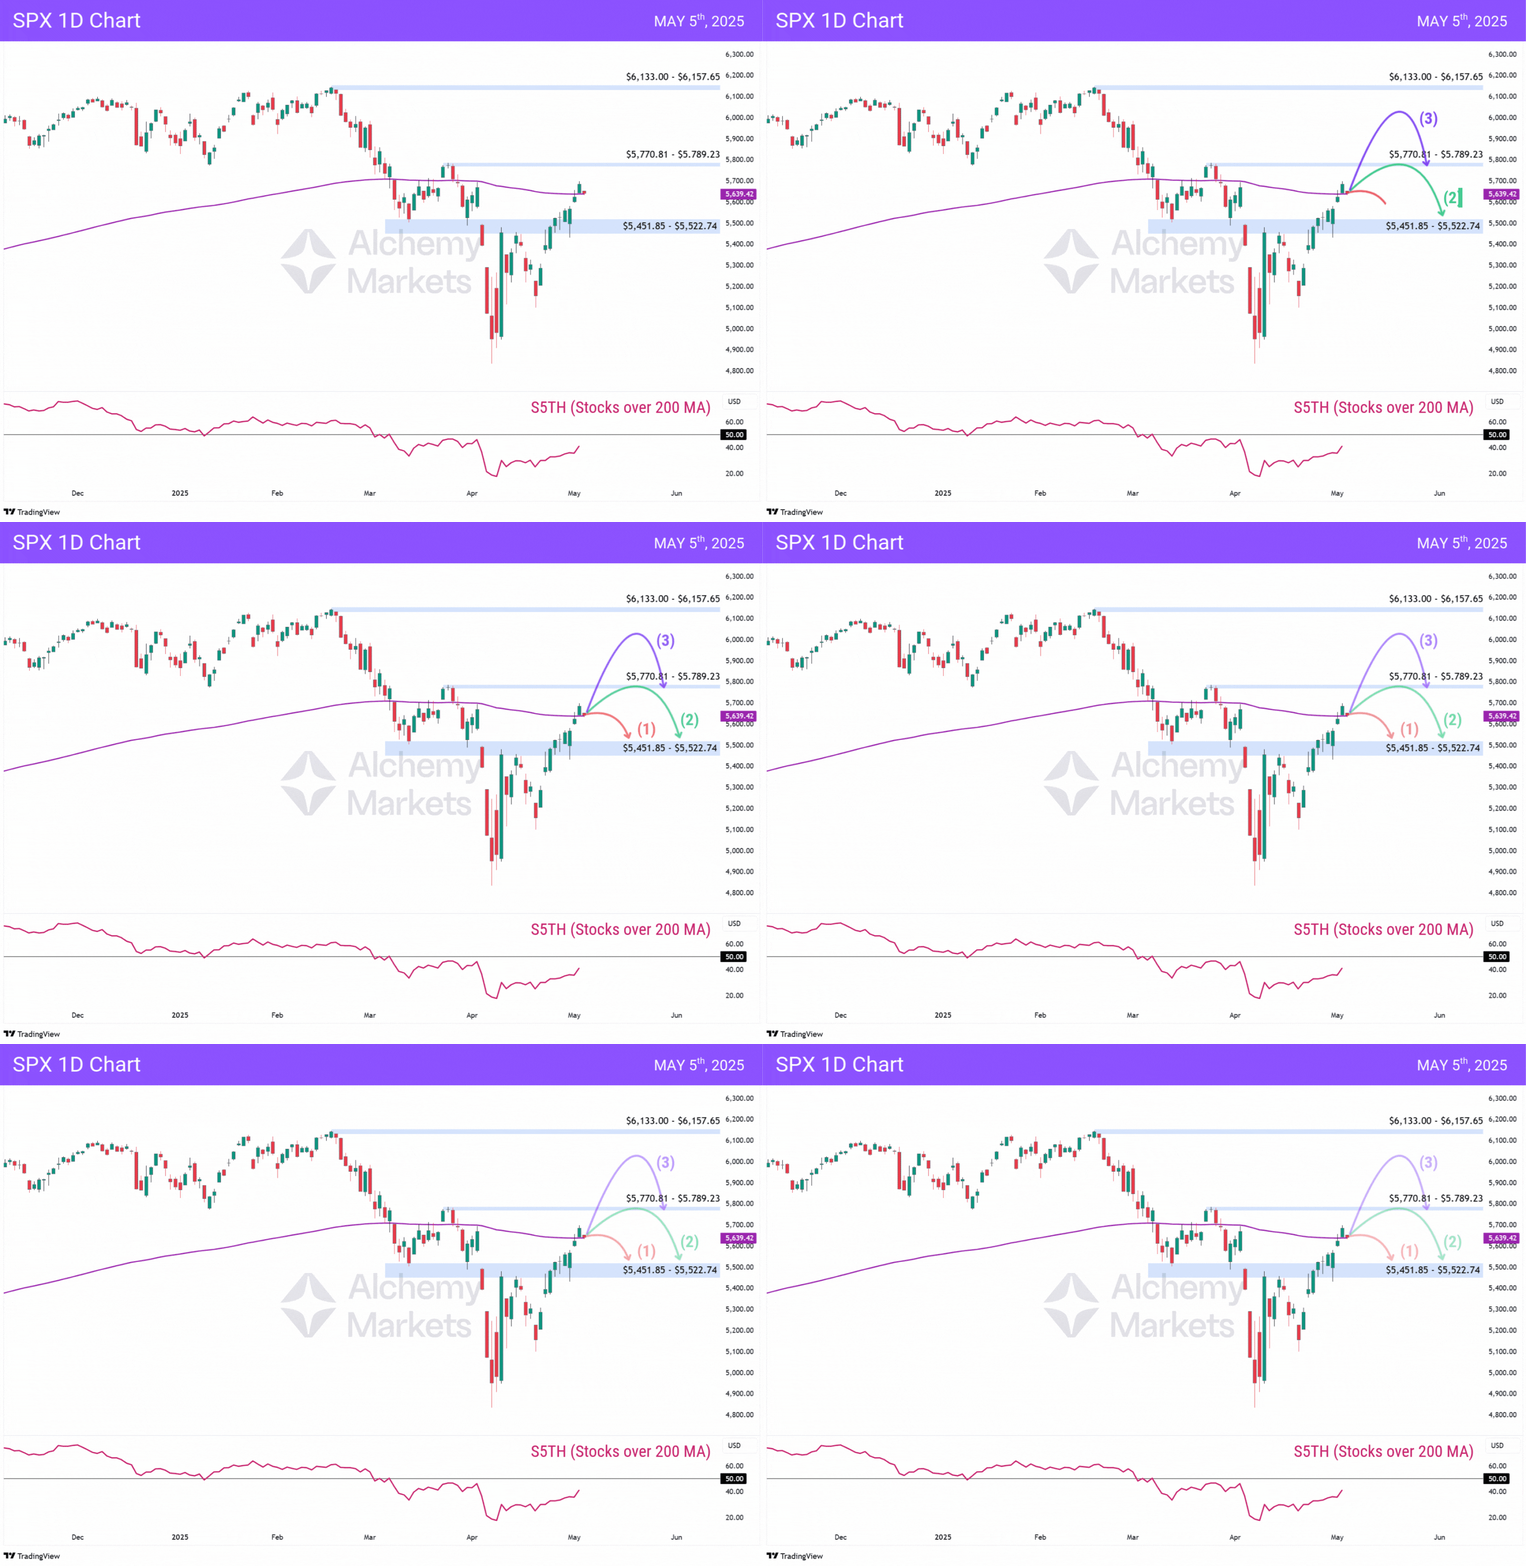
For the S&P, that level sits near 5,640. After a strong rebound off the 5,450–5,520 zone, price has paused, and this is where the rally needs to prove it has legs.
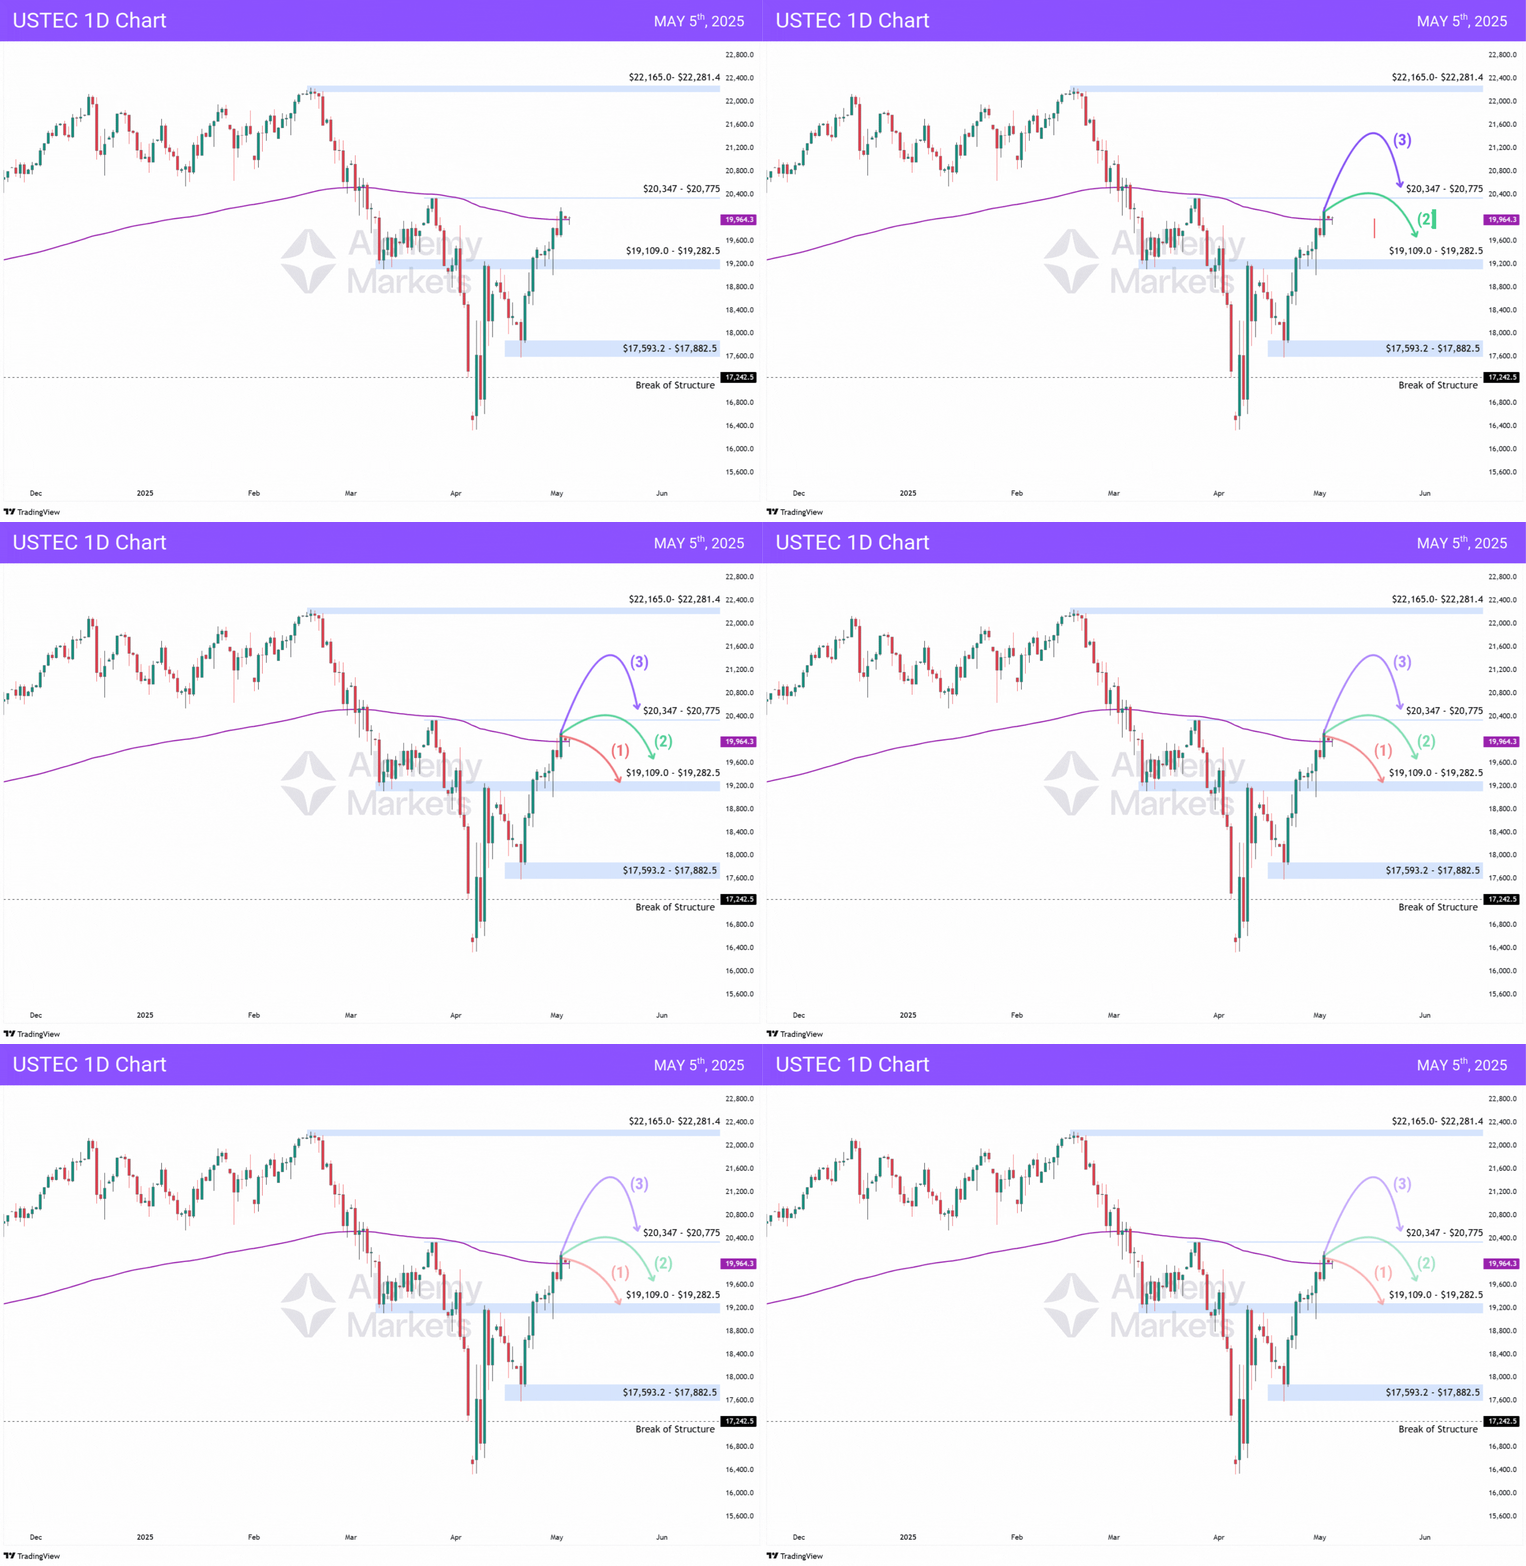
For the Nasdaq, price is also pressing into its daily 200 EMA after reclaiming key support from late April. The tech-heavy index has led the bounce, but like the S&P, it’s now running into a supply shelf where sellers have stepped in before.
S&P 500: Strong Recovery, Struggles with Bad Breadth
The S5TH indicator, which tracks the percentage of S&P stocks trading above their 200-day moving average, is still sitting under 50. That tells us less than half the index is participating in the move.
Yes, it’s recovering, and the momentum is better, but structurally it’s still weak.
If bulls can punch through this 200 EMA and hold, the next upside target comes in around 5,770 to 5,790. That’s the next real area of overhead supply.

Three Scenarios to Watch:
- Rejection now — pull back to support at 5,451–5,522.
- Grind higher — push into 5,770–5,789, stall there, then fade.
- Bull breakout — clear and hold above 5,770, then retest that zone as new support.
Bearish Case:
If we drop below (1), it’s either a bear trap or we’re setting up for a retest of the ~5,000 lows.
Nasdaq 100: Major Hurdle at 200 EMA
The Nasdaq 100 has been leading the bounce, but now it’s tagging the 200 EMA and pausing just beneath key resistance at 20,347–20,775. This is the same technical battleground where momentum broke down in March. Price has surged off the April lows near 17,600, but this is the first real test of trend durability.
Unlike the S&P, the Nasdaq has less of a breadth problem — but it still faces the same structural question. Is this a reset or a real trend resumption?
If bulls absorb this supply zone, the next upside target lands around 22,165–22,281. But a stall here opens the door for a healthy pullback or a more aggressive unwind.

Three Scenarios to Watch:
- Rejection now — fade back toward 19,109–19,282 support.
- Grind higher — push into 20,775, then reject and retrace.
- Bull breakout — clear 20,775, hold above, then retest that zone as support.
Bearish Case:
If we drop below 19,100, the risk grows for a deeper flush toward the 17,600–17,800 base — or worse, a full retrace to the 17,200 break.
Quick take
Strong bounce, but still narrow. Both the S&P and Nasdaq are now pressing into their 200 EMAs — a clear decision point.
The three key scenarios on deck: rejection at the moving average, a slow grind into overhead resistance, or a clean bullish breakout that flips resistance into support.
The next move will show whether this rally is ready to broaden — or just running on fumes.
You may also be interested in:


