


Written by:


- Chart of the Day
- February 13, 2025
- 2 min read
Hang Seng Index 1H Rejection Candle: Cool Off After CNY Rally?
During February, the Hang Seng Index (HSI and HKG50) saw a significant rally of 13.94% from the lows at $19,570 to $22,520.
This rally came with the celebration of Chinese New Year, a time when Hong Bao (red packets containing cash) are distributed amongst family and friends. Clearly, some of these packets have been invested into the Hang Seng Index, fuelling the rally.
Currently, the index has seen some major red candles on the hourly timeframe, signalling a potential cool off period.
Technical Analysis of HKG50 (Hang Seng Index CFD
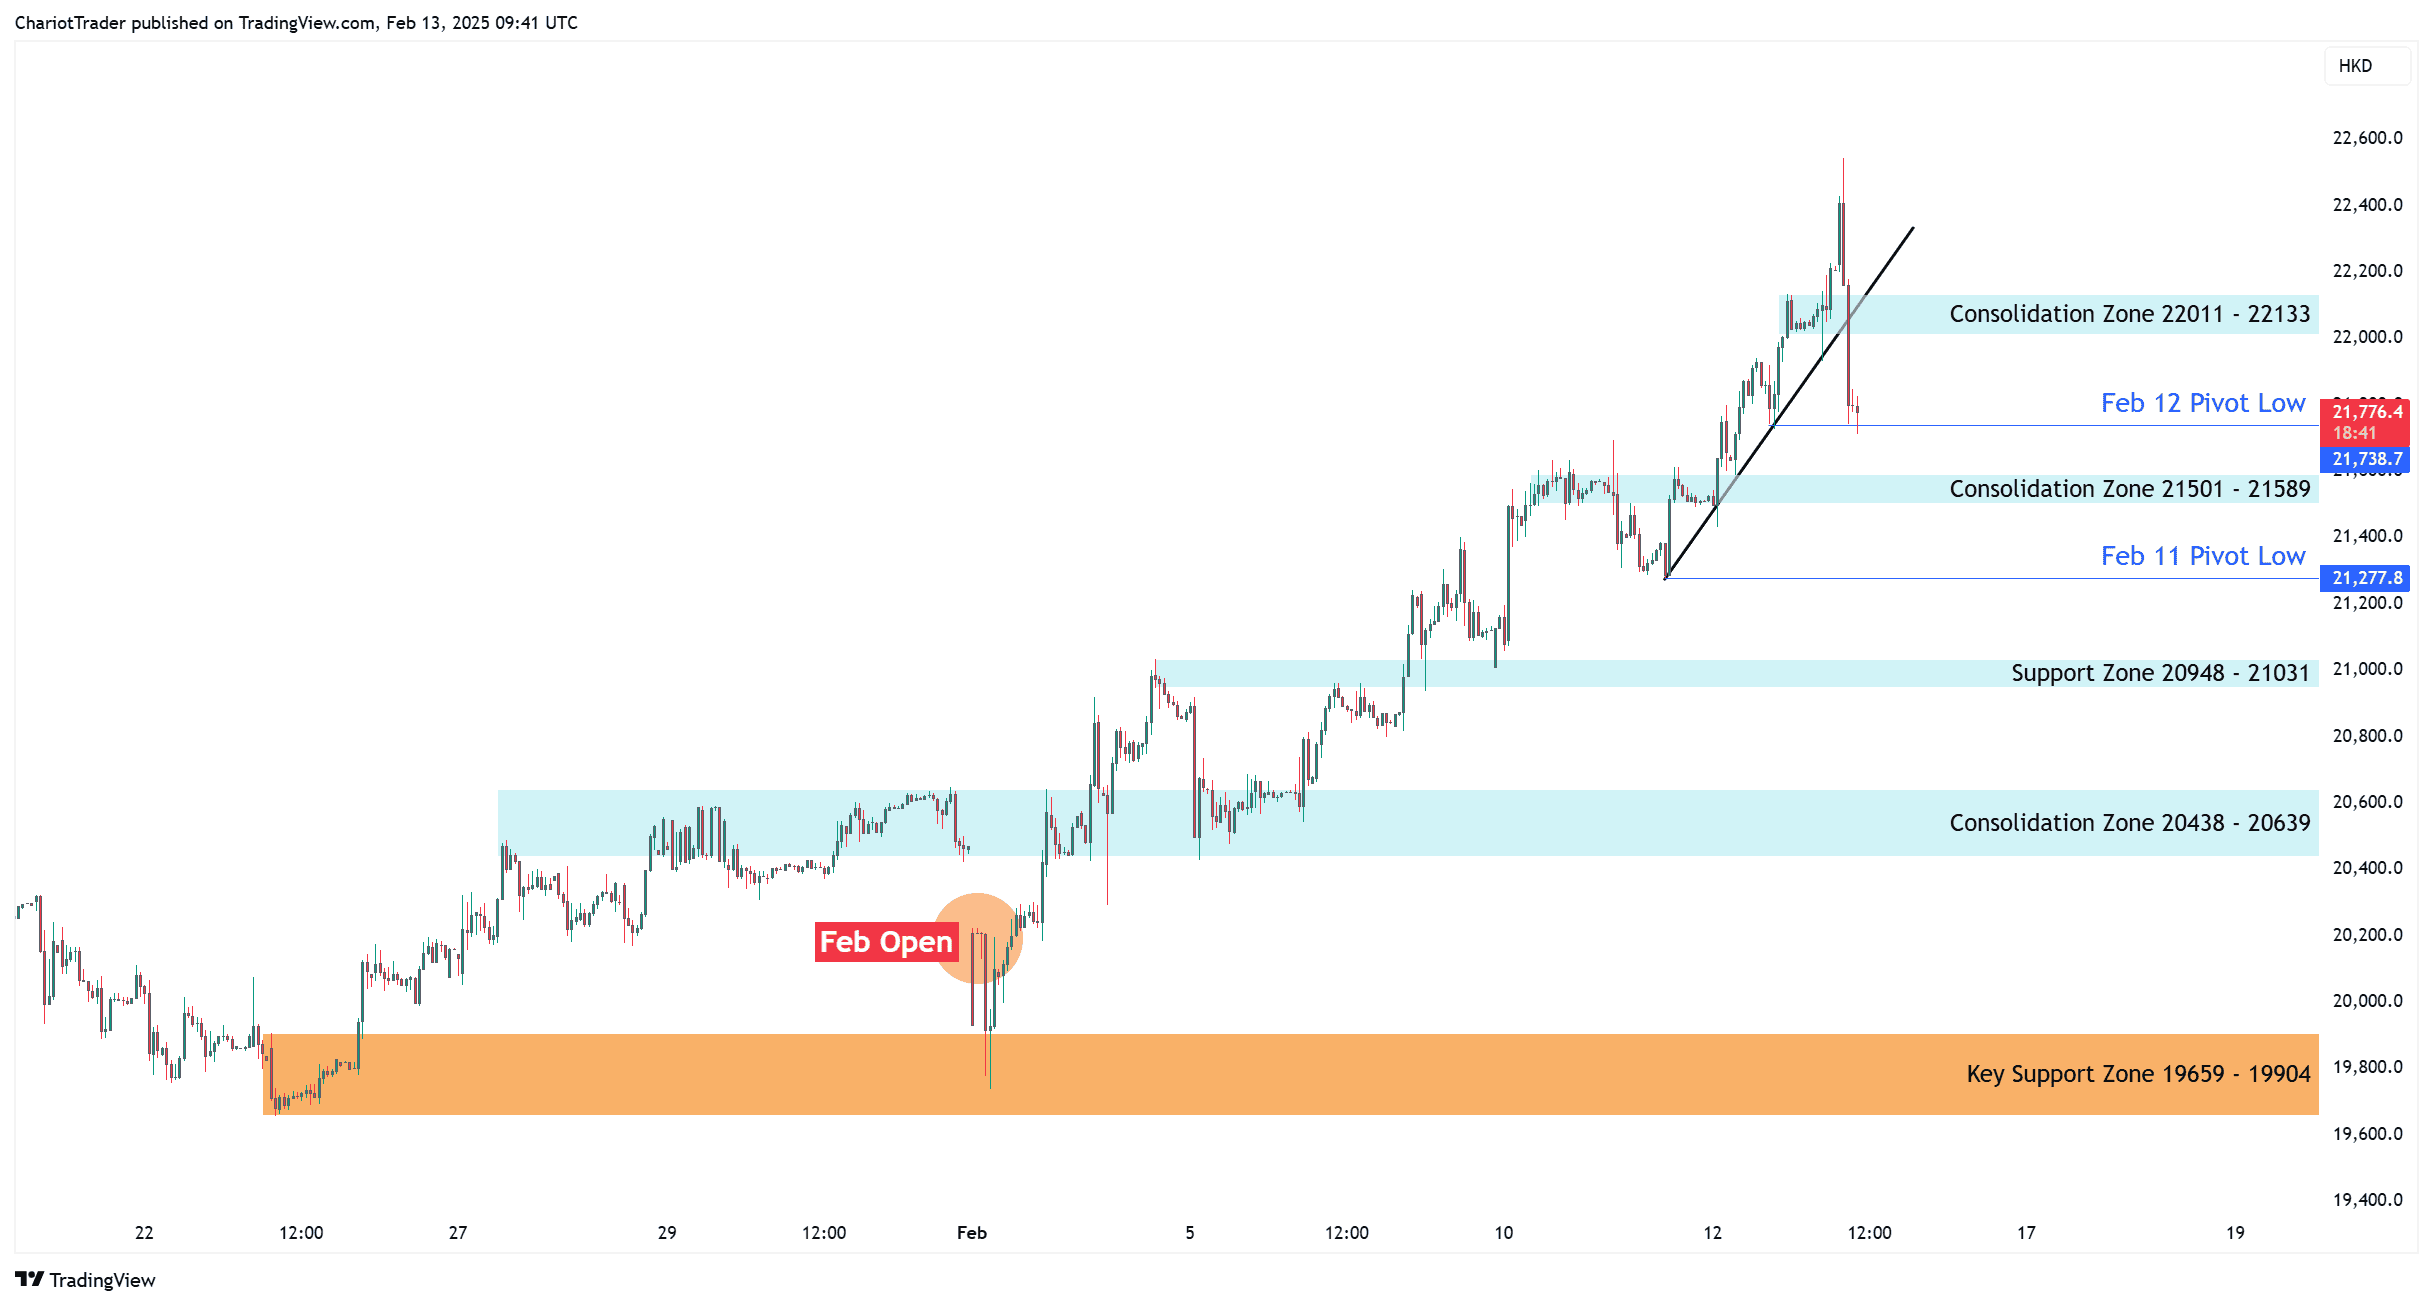
On the 1-hour chart, we can see a clear trendline break, triggered by two strong bearish candles. This suggests the Hang Seng Index may enter a corrective ABC structure, cooling off from the CNY rally.
ABC Correction: At this stage, we could expect a temporary bounce that stays below the recent highs, followed by a rejection that pushes the price lower—though not beyond the key support zone at $19,659–$19,904.
Right now, the price is sitting at yesterday’s pivot low of $21,738, which could act as support.
From here, the index may either consolidate or retest resistance at $22,011–$22,133, a zone created by previous consolidation.
If this support doesn’t hold, the next support zone is between $21,501–$21,589.
This was previously a resistance area where the index consolidated before breaking out, meaning it could now act as strong support. Since this zone remains untested, buy orders here have not yet been mitigated, making it a potential level for a major bounce.
The other support levels to look for are:
- Feb 11 Pivot Low at $21,277.80
- Support Zone at $20,948 – $21,031
- Consolidation Zone at $20,438 – $20,639
- Key Support Zone $19,659 – $19,904
Overall, the Hang Seng Index remains in an uptrend until the key support zone at $19,659 is broken.
You may also be interested in:


