- Chart of the Day
- November 15, 2024
- 2 min read
Gold Recovery Possible: 4H Falling Wedge with Bullish Divergence
Since the beginning of the month, XAU/USD (Gold) has been seeing a decline of nearly 8.00%. This is the sharpest decline we’ve seen on Gold all year, even going back as far as March and August 2020.
This could be due to market expectations of a more pro-growth environment in the coming months, as well as Trump’s isolationist / anti-war sentiment, which could contribute to the markets not feeling like they need to run towards gold as a safe haven.
Classic Bullish Divergence and Falling Wedge on 4H Timeframe

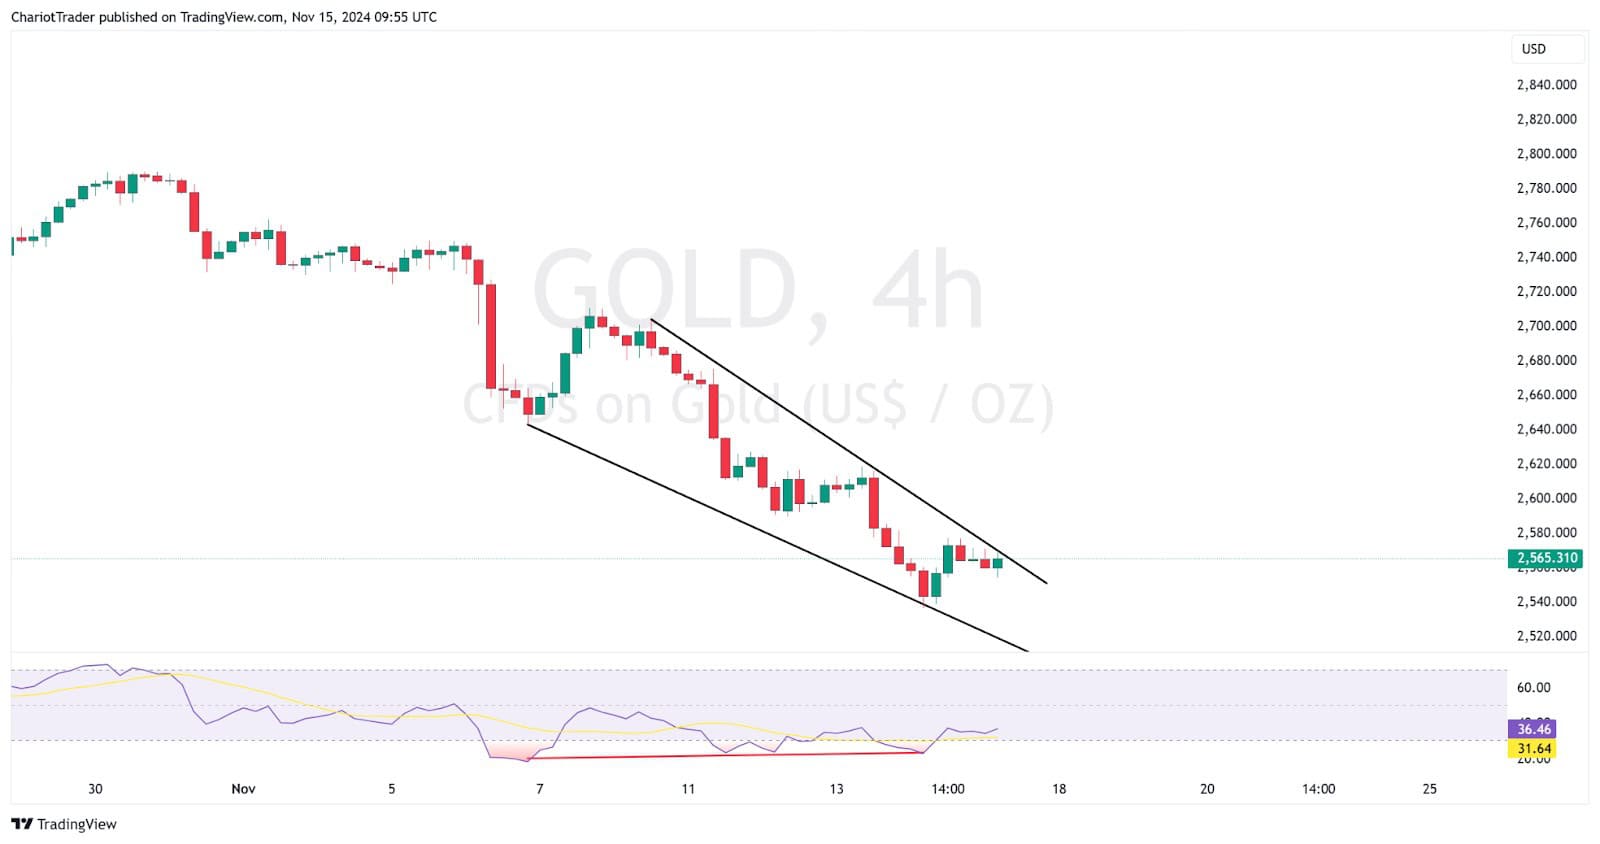
Currently, the price of gold is trailing just under the upper trendline of a falling wedge pattern. This is a bullish reversal pattern, which has more weight when a bullish divergence is present in the chart. If broken out of, the price of gold may revisit the top of the wedge at $2,704.120.
However, traders must be aware that not all falling wedges break out towards the upside, nor will price revisit the top of the falling wedge every time. So caution is advised.
Key Levels to Watch on XAU/USD (Gold)

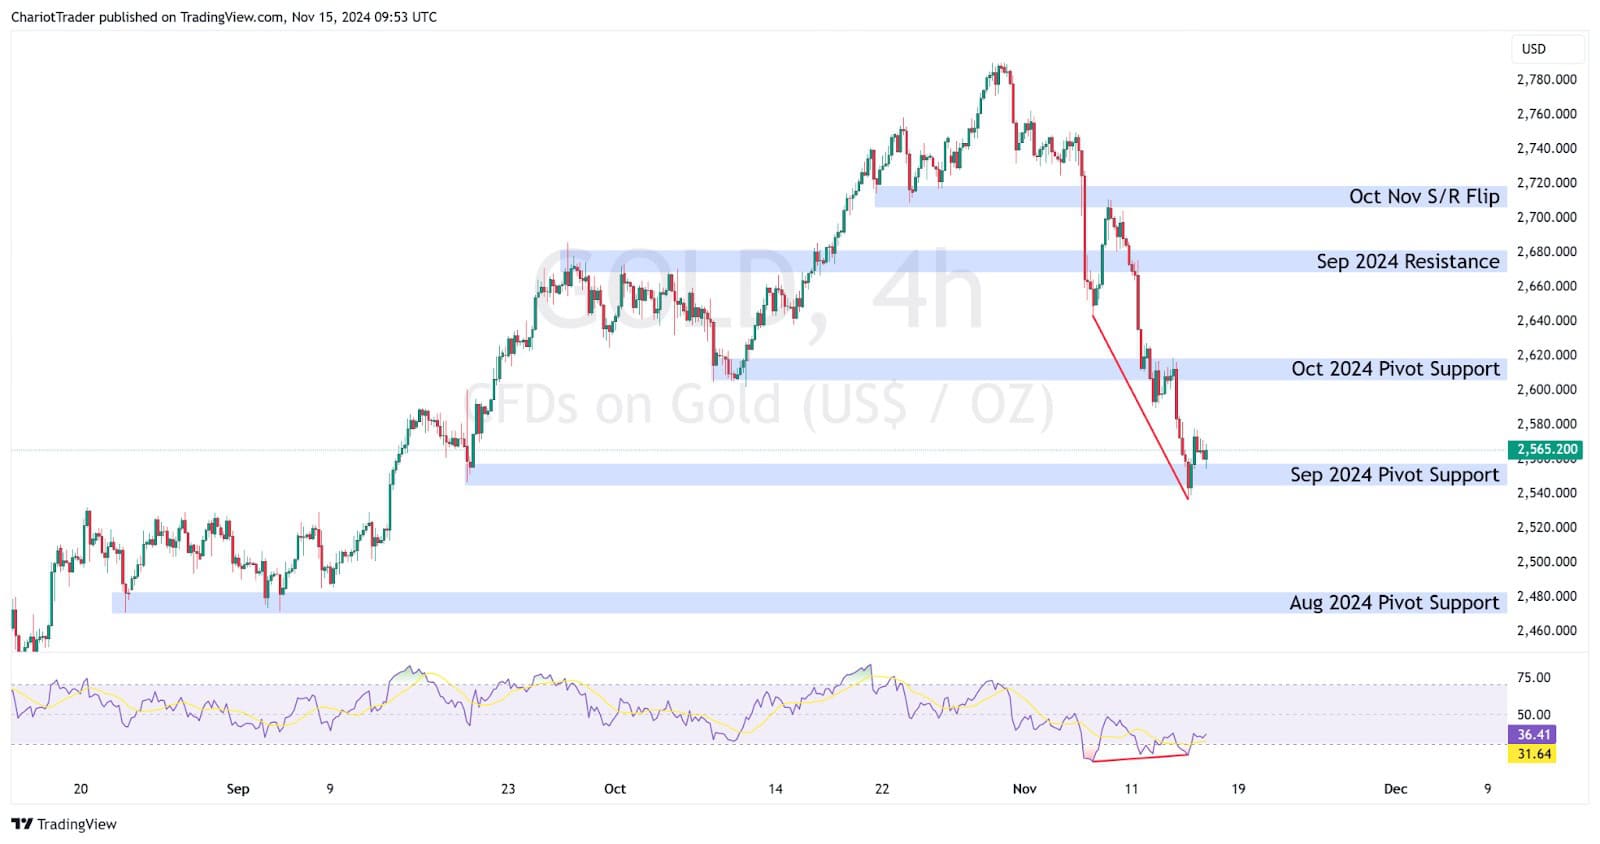
Several key levels come to mind for Gold. Depending on how the falling wedge breaks, we could visit lower price zones at support, or revisit higher prices at resistance.
The upper trendline resistance is currently where Gold is struggling, at around $2,650 to $2,655. A rejection from here could allow Gold to revisit its lower trendline, or potentially form a double bottom at the September 2024 Pivot Support area of $2,540 – $2,555.00.
| Support | Price zone |
| Lower Trendline Support | $2,520 region |
| September 2024 Pivot Support | $2,540 – $2,555 |
| August 2024 Pivot Support | $2,470 – $2,485 |
Conversely, a breakout and close above the upper trendline could result in higher prices in coming days – with the falling’s wedge price target being at $2,704.120.
| Resistance | Price zone |
| Upper Trendline Resistance | $2,650 region |
| October 2024 Pivot Support | $2,605 – $2,620 |
| Falling Wedge Price Target | $2,704.120 region |
| Oct Nov S/R Flip Zone | $2,705 – $2,720 |
You may also be interested in:


