


Written by:

- Chart of the Day
- June 27, 2024
- 2 min read
GBPJPY: Monthly Double Bottom, Trading Inside a Daily Parallel Channel
There is a potential for a move of over 8,000 pips on GBPJPY, thanks to a gigantic double bottom pattern from 2008. Now, the question is: will it really play out?
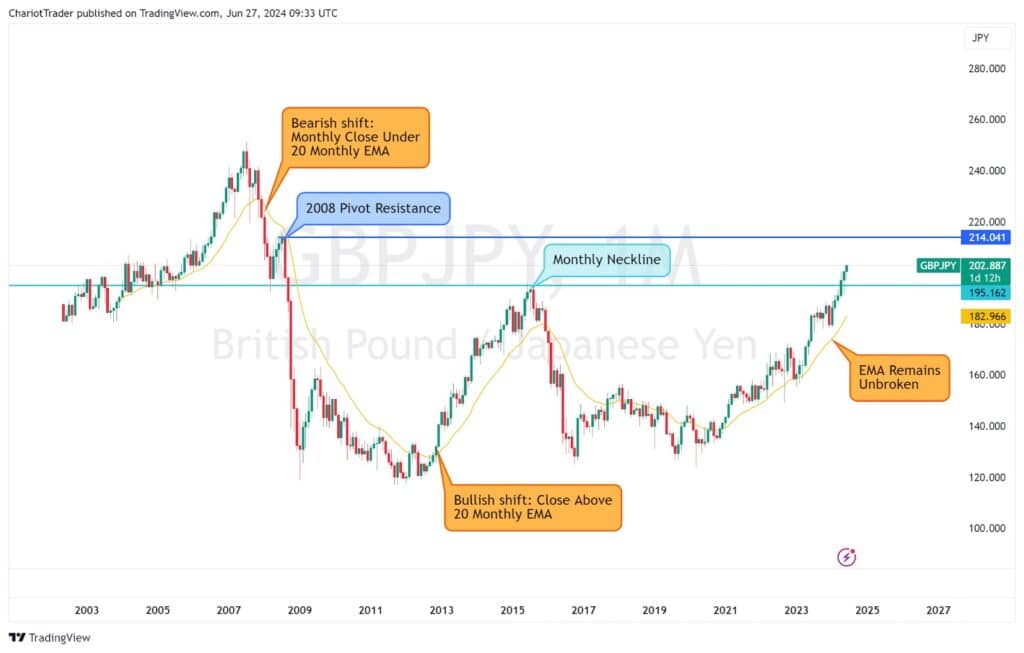
Zooming out to the monthly timeframe, we can see a clear double bottom formation with a successful break of the neckline. The asset has also remained steadily above it for 2 months, and we’re headed towards a third bullish monthly close.
Given the Bank of Japan’s reluctance to raise interest rates, investors may be running to GBP to earn from the 5.25% interest rate. Of course, there have been talks of an interest rate cut for the British Pound, coming as soon as early August.
In such a scenario, GBPJPY may create a bullish retest of the monthly double bottom neckline, located at 182.966.
So which areas should we focus on?
Traders are advised to pay attention to the 2008 Pivot Resistance at approximately 214.041 yen, as that is where a significant price decline has previously occurred.
Additionally, setting a Monthly 20 EMA is a great idea to gauge whether the bullish rise is over. As long as the price does not make a monthly close below this EMA, GBPJPY has the potential to keep rising.
Finally, the price is currently consolidating within a daily parallel channel, where the middle line, upper line, and bottom lines are clearly respected.
GBPJPY Daily Timeframe Analysis (June 27th, 2024)
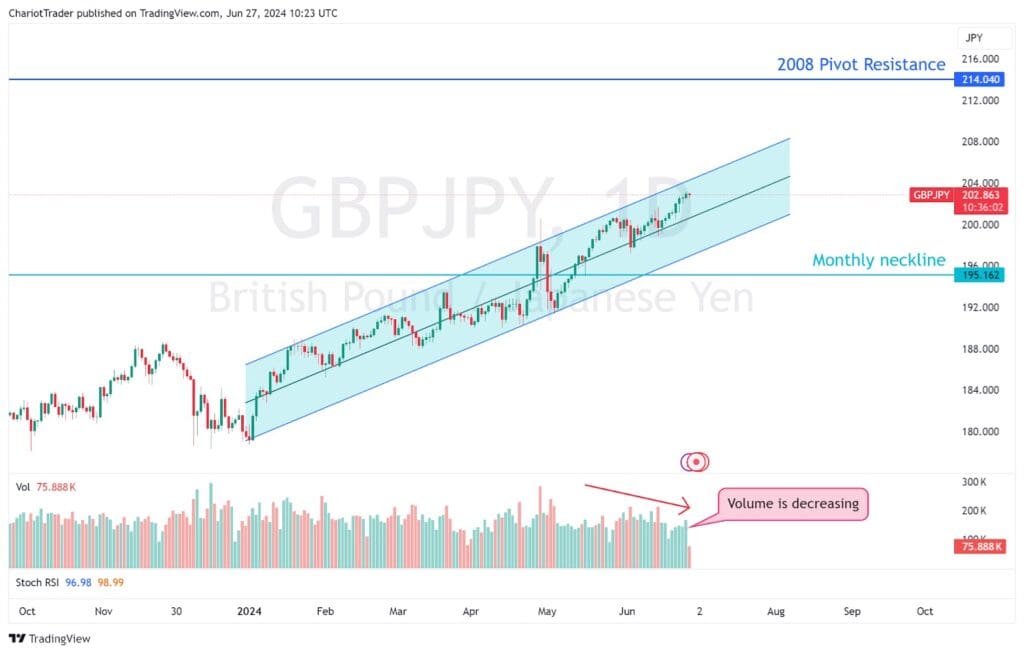
Zooming in on the daily chart, we can see a clear, ascending parallel channel. This is a bearish sign in the short term. If the parallel channel breaks towards the downside, we can see a retest of the monthly neckline at $195.162.
Resistances wise, we have the upper parallel channel trendline, and the 2008 pivot resistance at $214.040 up ahead.
Additionally, we have decreasing daily volume, which supports the idea of a temporary drop.
You may also be interested in: Trading Chart Patterns.


