


Written by:


- Chart of the Day
- July 7, 2025
- 2 min read
Euro-Dollar at Critical Volume Resistance
EUR/USD is pulling back after tagging major resistance between 1.178 and 1.194 — a zone defined by long-term volume profile clusters and the underside of a key trendline from the 2021 breakdown.
This level aligns with the top of a rising channel (blue lines) and has historically acted as supply. Price stalled here last week, and now a minor pullback is underway.
Additionally, we have what appears to be a longer term bearish RSI divergence, and a near term bearish RSI failure swing.
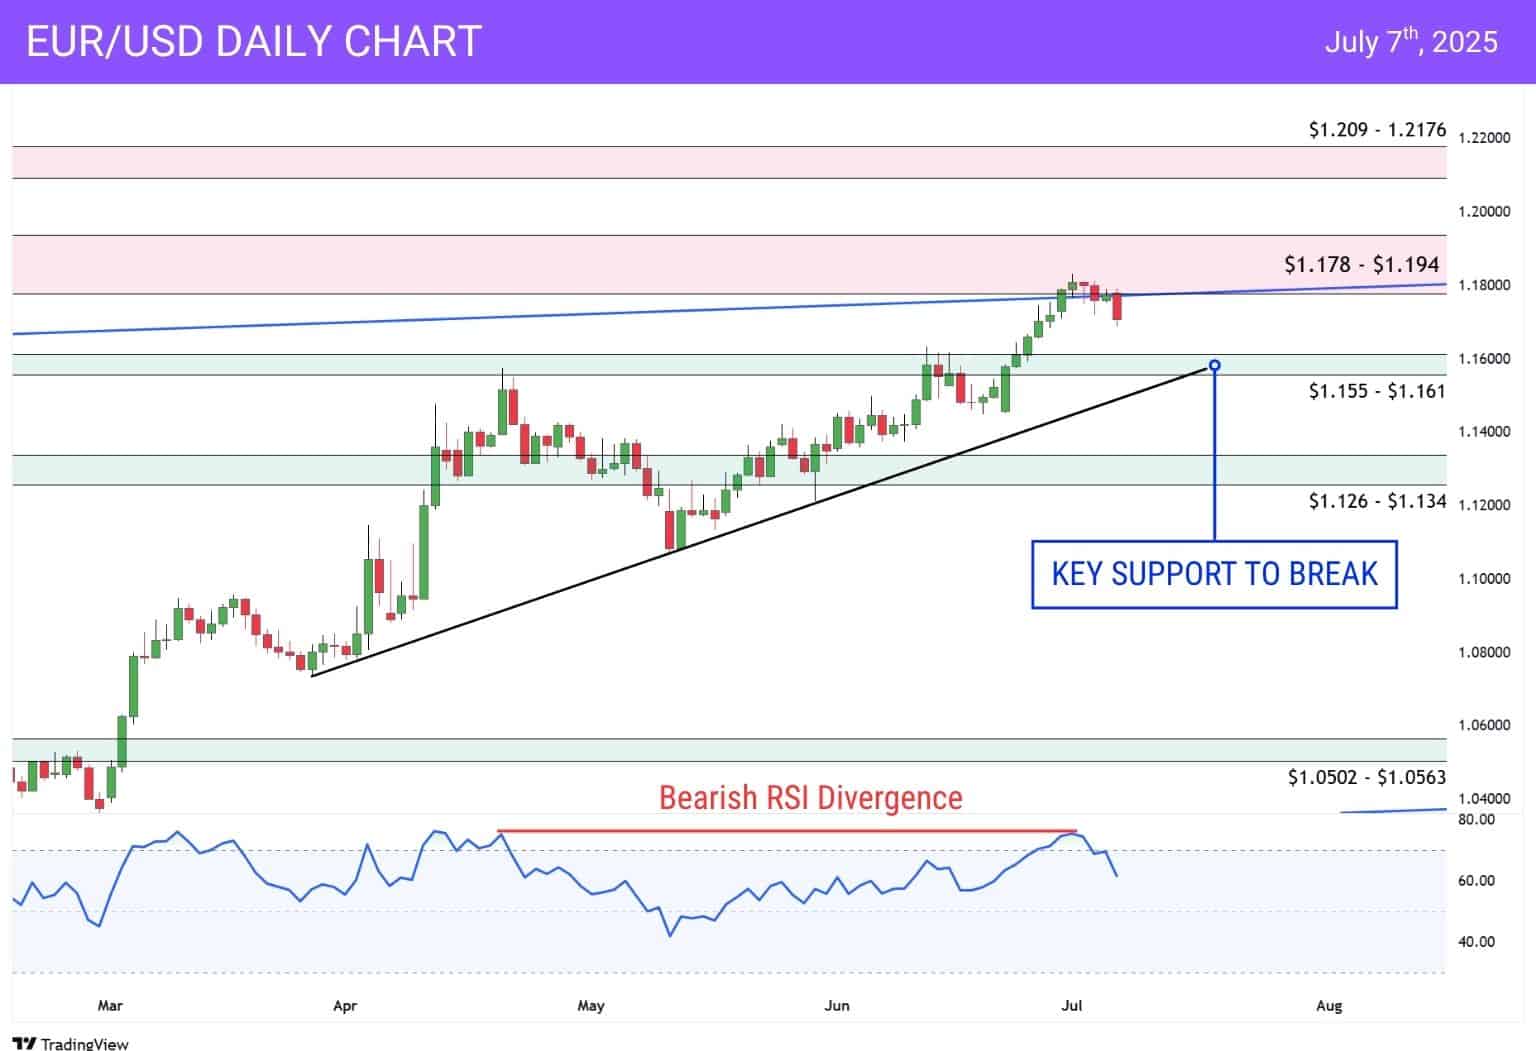
The near-term support to watch is 1.155 to 1.161. This level has already held once and is reinforced by the rising trendline from April’s low.
If that breaks, the correction may deepen into the 1.126–1.134 zone. This area acted as a springboard for the recent rally and would mark the first significant bullish retest.
The weekly chart adds more weight to the resistance. Price is reacting from the 1.178–1.194 HVN, just under the final resistance shelf at 1.209–1.217 — the same distribution zone from mid-2021.
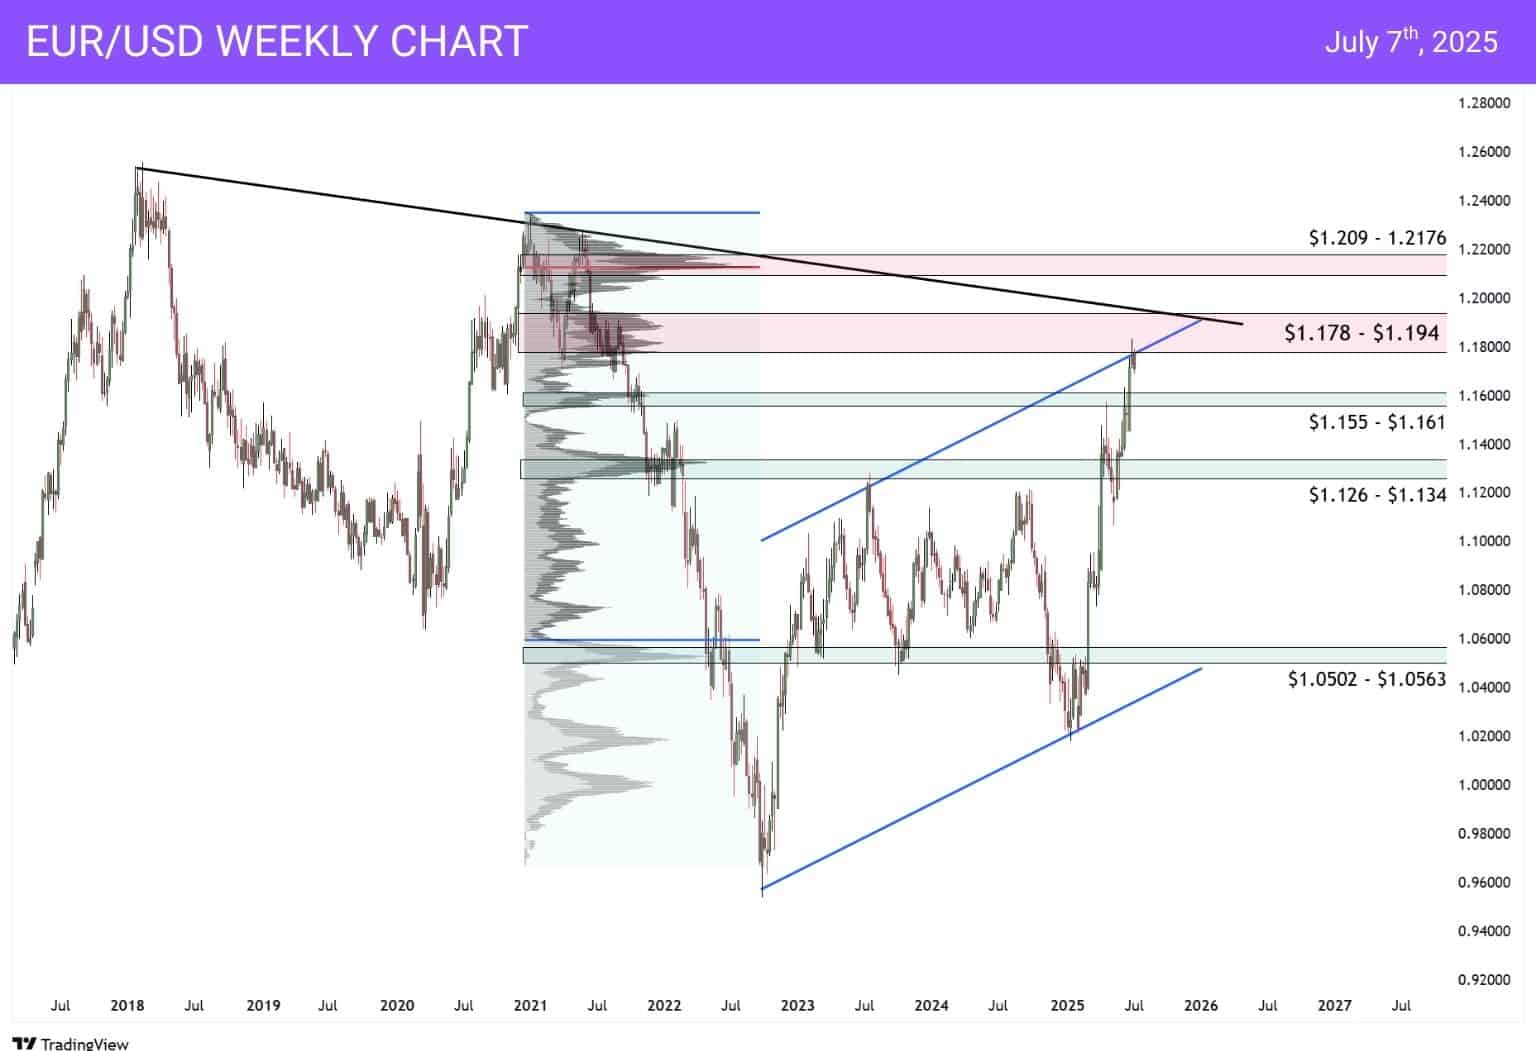
Trend support from the 2022 low remains intact. A breakdown through 1.155 would confirm a short-term top and set the stage for a broader pullback through Q3.
Until then, the structure is still bullish — but it’s time to watch how price behaves around these pivot levels.
You may also be interested in:


