


Written by:

- Chart of the Day
- February 18, 2025
- 3 min read
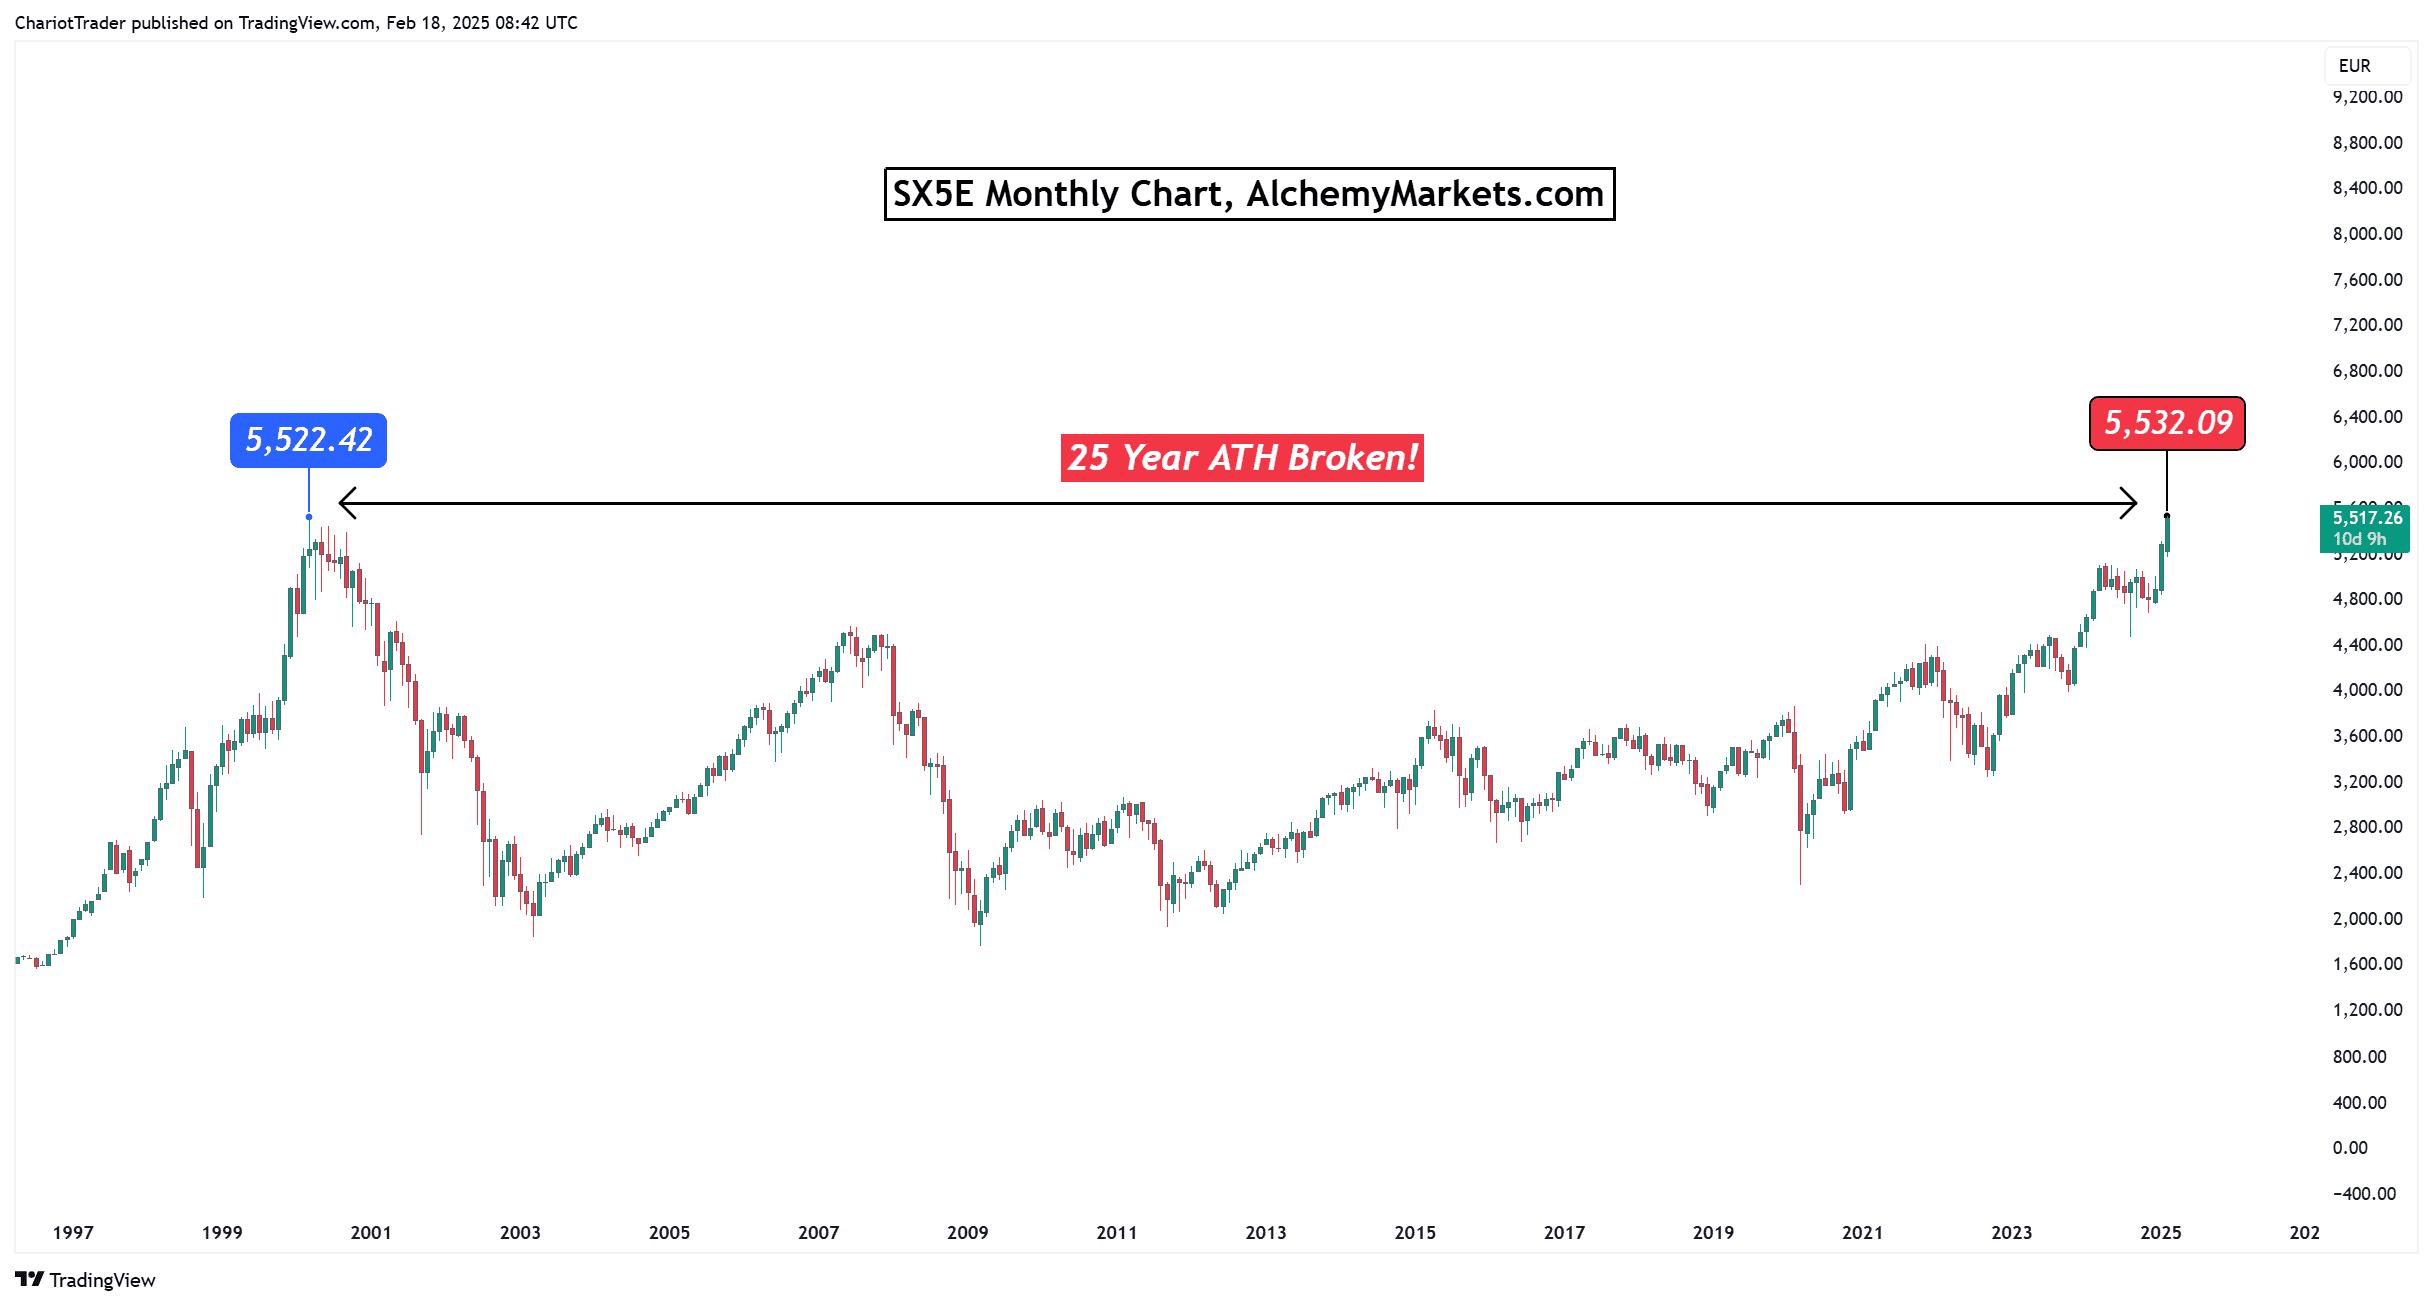
New All-Time High in 25 Years for Euro Stoxx 50 Index

While everyone was talking about gold, the S&P 500, DAX, Nasdaq and Bitcoin in January and February, the Euro Stoxx chart has been making significant progress — breaking its all-time high of 25 years in 2025!
This significant price action will either mark the beginning of a blue sky rally, where an asset continuously breaks its all-time highs, or a powerful rejection from a major resistance level.
Why did the SX5E (STOXX50 CFD) rally?
The EURO STOXX 50 Index’s recent all-time high is underpinned by several fundamental factors:
- Geopolitical Developments: Hopes for a ceasefire between Russia and Ukraine have bolstered investor confidence, potentially leading to stabilized energy prices and improved economic conditions in Europe.
- Increased Defense Spending: Anticipation of higher military budgets across European nations has led to a surge in defense sector stocks, contributing significantly to the index’s rise.
- Banking Sector Strength: European banks have experienced a robust rebound, with indices tracking the banking sector showing impressive returns, further propelling the overall market.
- Attractive Valuations: European equities have become more appealing to investors due to their lower valuations compared to U.S. stocks, prompting increased capital inflows into the region.
- Cyclical Behaviour: Ever since 2020, the index has shown the behaviour of one year up, one year down. If this pattern is to repeat, 2025 would be a bullish year for SX5E. For the most part of 2024, the index has trailed down by 7.00%.
What’s Next: STOXX50 Technical Analysis
Let’s switch over to the CFD version of the SX5E—the tradeable version of the Euro Stoxx Index—to find key levels and spot for signs of strength and weakness.
The Rundown:
- After breaking the €5,100 zone, STOXX50 made a rally into the previous SX5E ATH at €5,522.
- Then, CFD prices closed at a brand new ATH of €5,528.60 on February 17th, 2025.
- For the entirety of February, STOXX50 has just been in an uptrend.
- There are NO bearish divergences on the RSI and ADL (Market Breadth), but volume has been decreasing for the past 3 days.
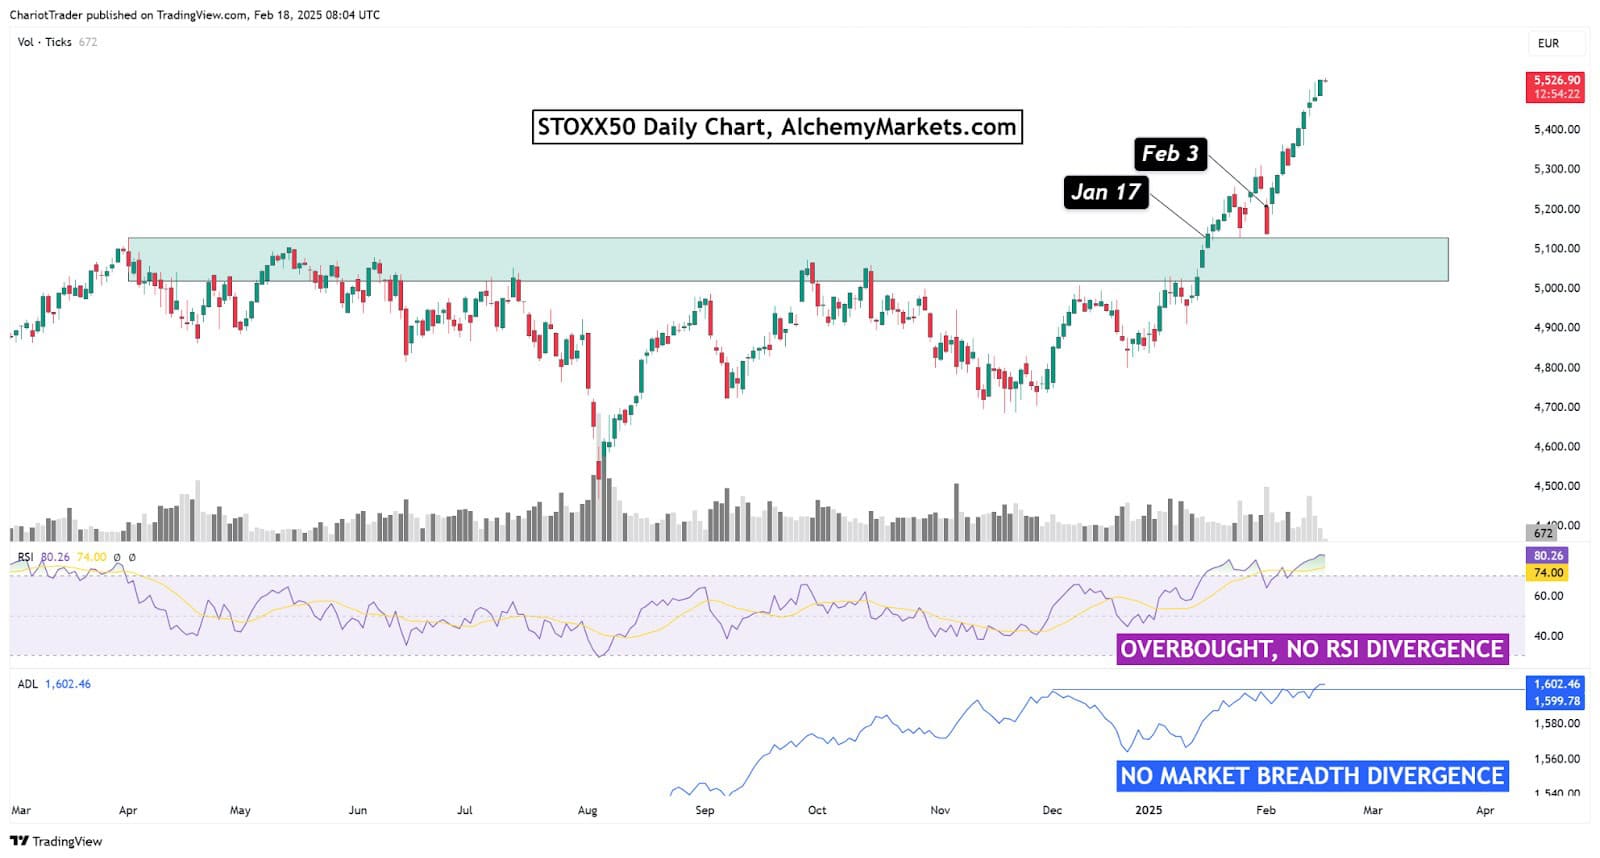
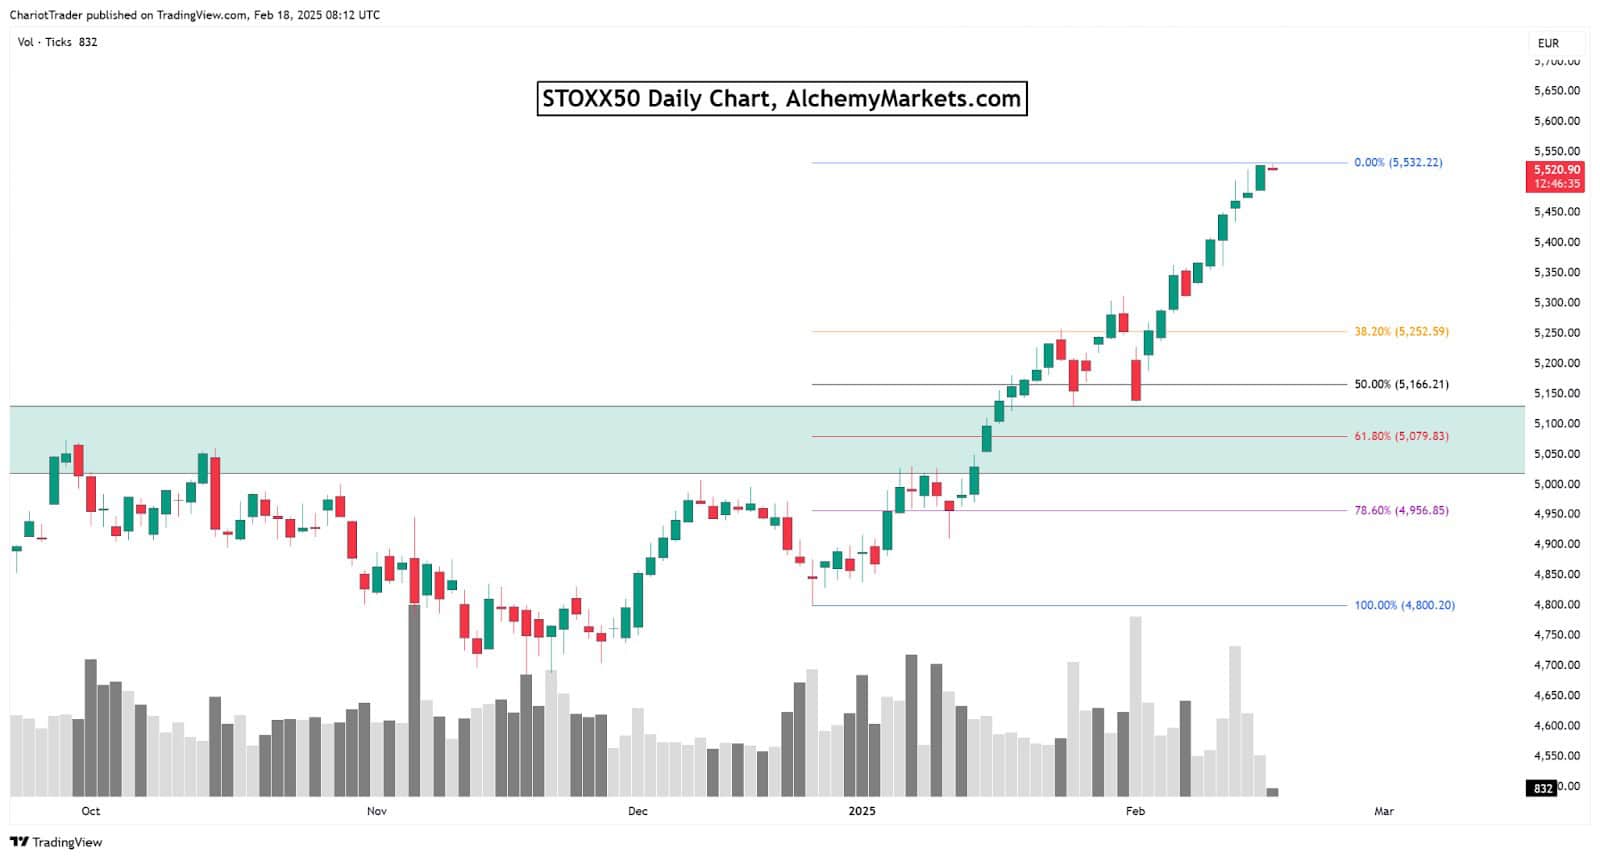
The weakening volume signals a potential cool off period coming. If a cool off does occur, the key levels are as follows:
- €5,252.59, €5,166.21, €5,079.83 (Key Level), €5,019.30 – €5,130 (Critical Support Zone)
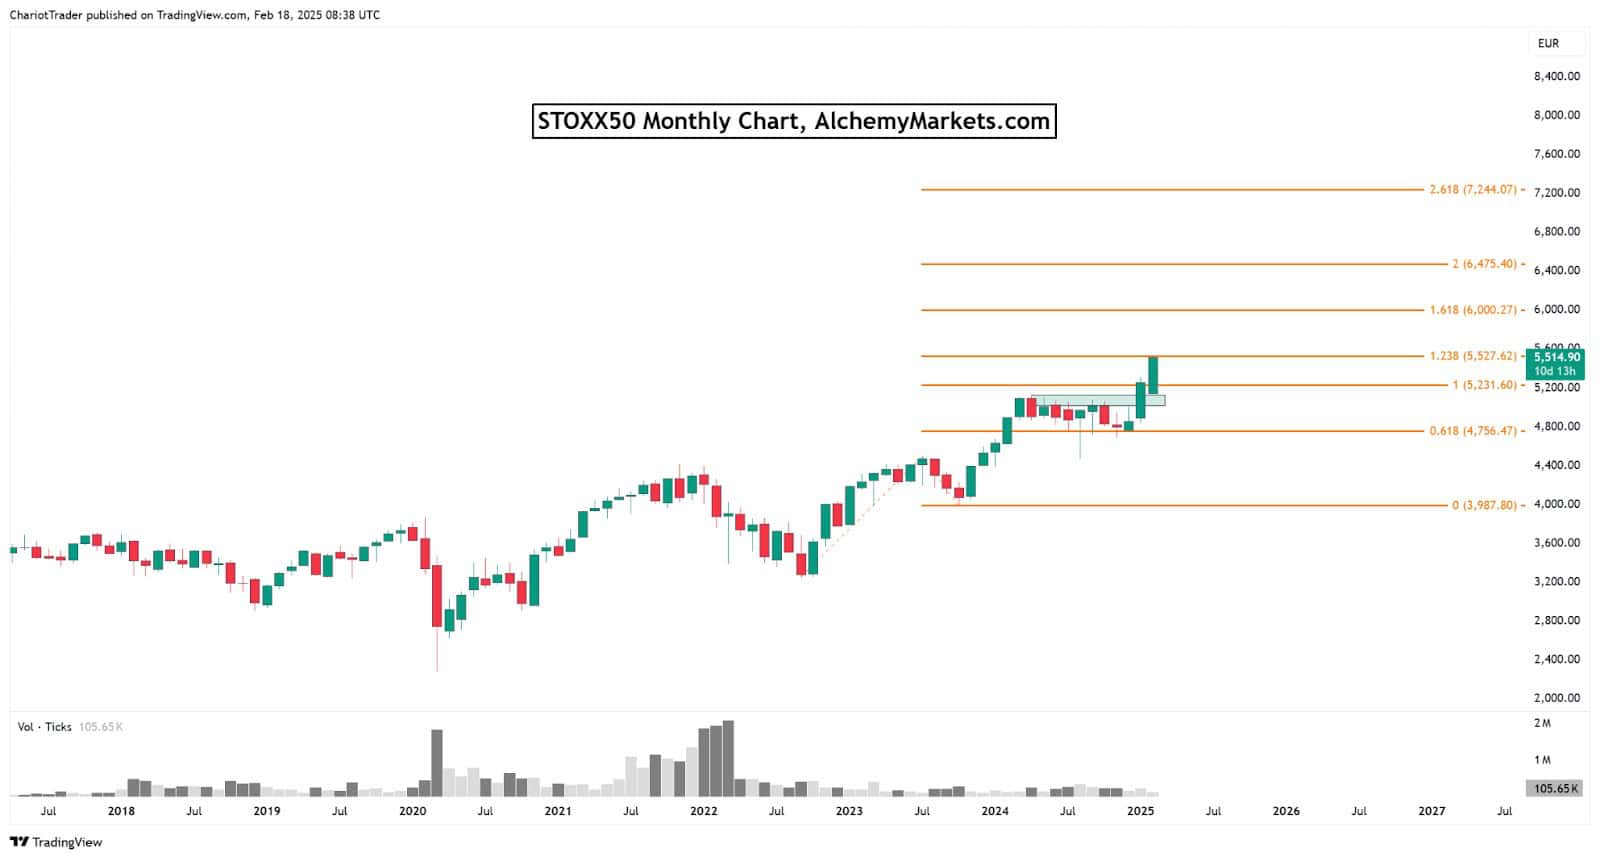
However, if STOXX50 is going to rise even further, the resistances can be estimated by the Fib Extension Tool, drawn from the pivots from Sep 2022, to July 2023, back down to October 2023.
- €5,527.62 – Current resistance
- €6,000.27 – Fib Extension 1.618 and Psychological Level
The €6,000 zone would be a key resistance area to watch, as it is not only the 1.618 extension, but also a critical psychological level.
You may also be interested in:


